Enter study data manually
Below are the manual steps for entering study data into RevMan. This can be a good approach if you have a smaller number of studies and results.
If you have a larger data set, using the CSV import will likely be more efficient.
Go to the Studies section in the left-hand navigation and select Included studies.
1. Enter general information
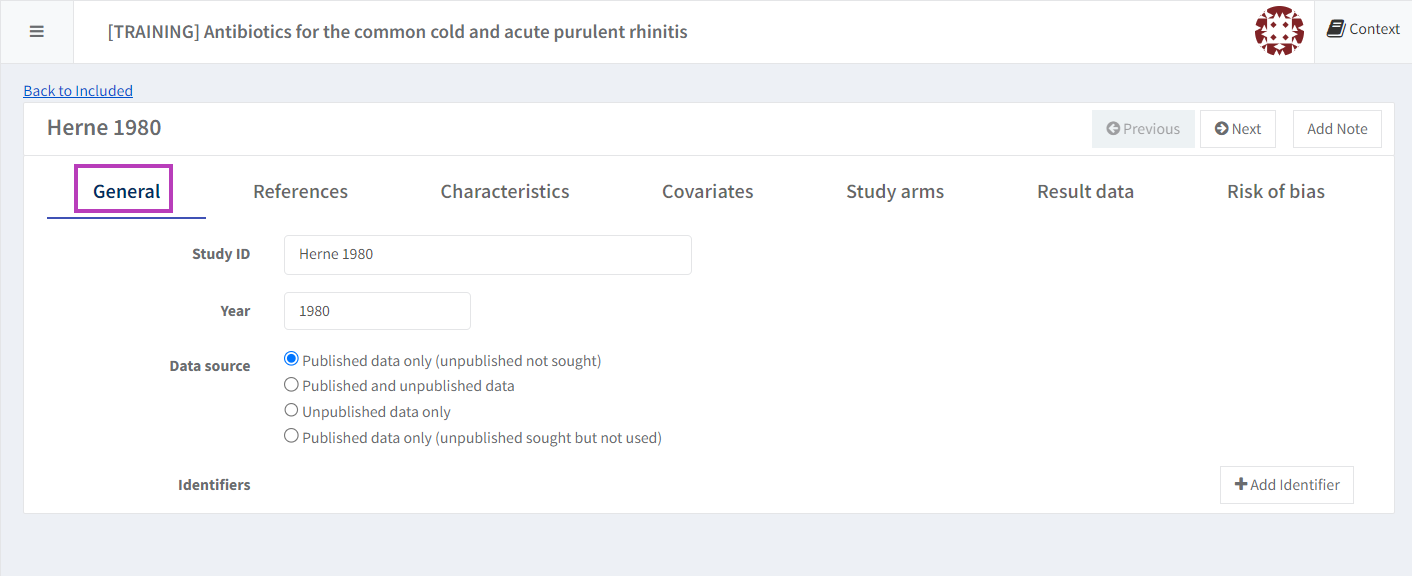
Select the ‘General’ tab, to edit the Study ID, year of publication and the data source.
2. Edit study reference
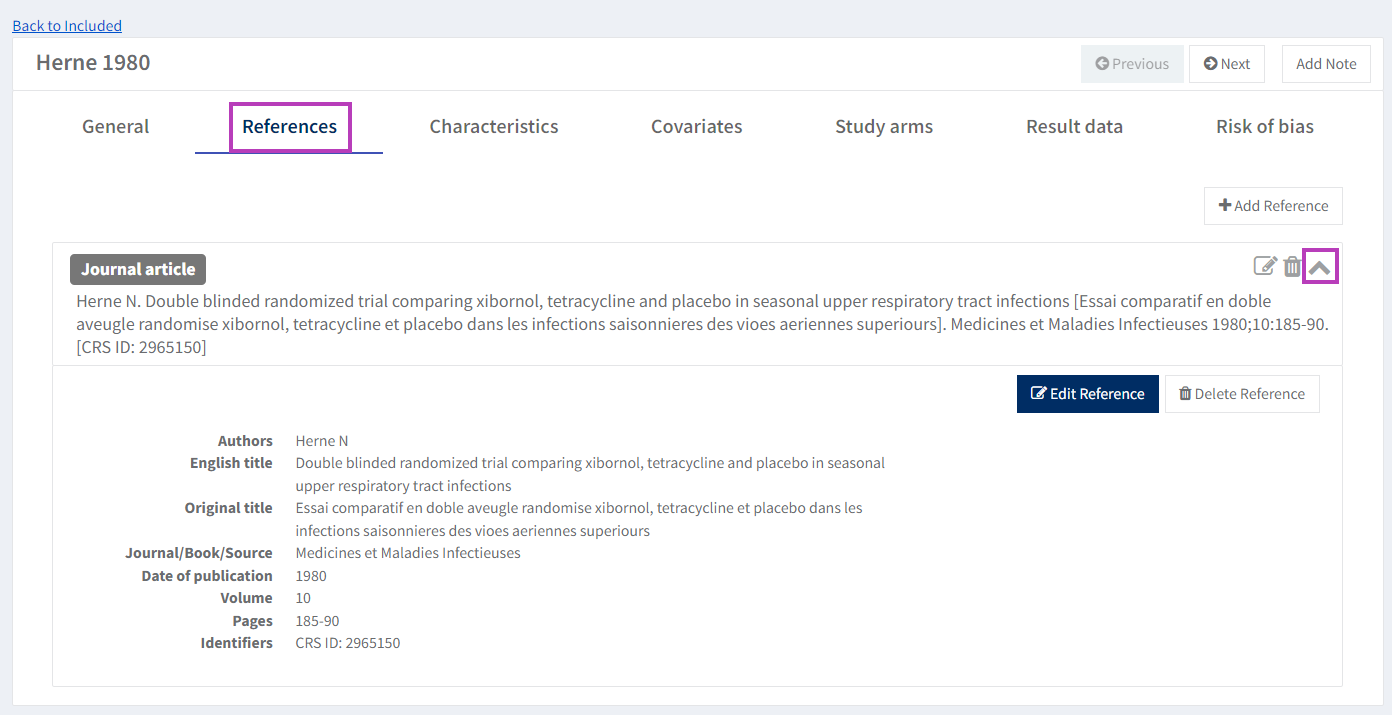
On the 'References' tab, click on the arrow icon to reveal the reference, then click on the 'Edit' button.
If you have more than one report of an included study, see How to mark a report as a primary reference.
You can remove the reference by clicking the 'Delete' button.
3. Enter study characteristics
In the ‘Characteristics’ tab you can edit the description of the characteristics of the included study.
3.a Paste study characteristics
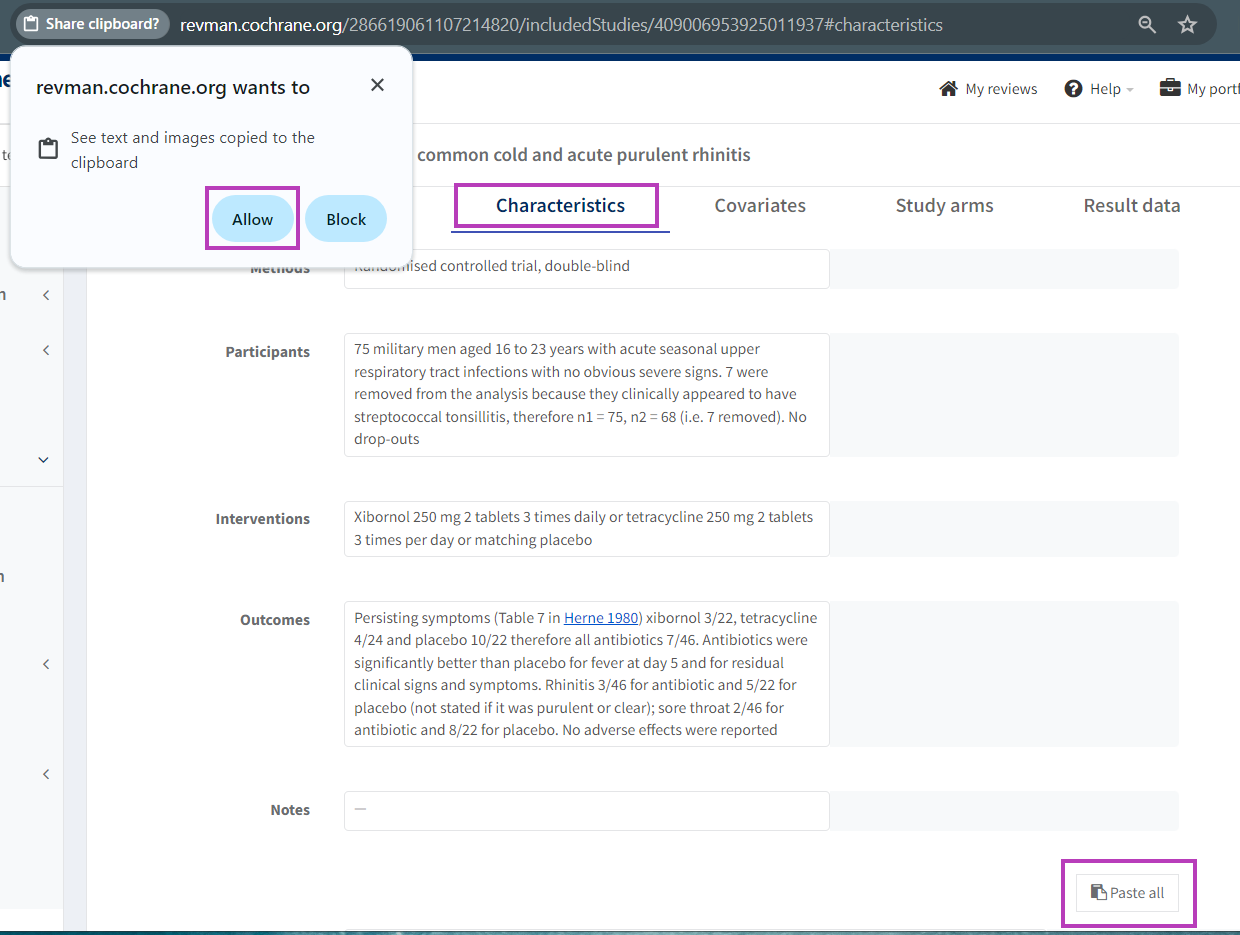
In the ‘Characteristics’ tab you can paste the description of the characteristics of the included study that you have copied from a table on an external source. The external source could e.g. be a webpage, a Word document or a spreadsheet.
Please ensure you tag a version on the Review Dashboard before editing any characteristics, as pasting will override any text already in the text boxes.
Copy the table (horizontal or vertical) from an external source and click the 'Paste all' button at the bottom of the ‘Characteristics’ tab. Your browser may ask you to allow RevMan to access your clipboard. Please click 'Allow' to use this feature.
Please note the formatting that will be copied:
- Word: paragraphs italics, bold, underline and links are supported
- Spreadsheets: links and paragraphs are supported
- Web page: depend on tags used (italics, bold, underline and links are supported)
4. Enter result data
4.a Enter the study's intervention arms
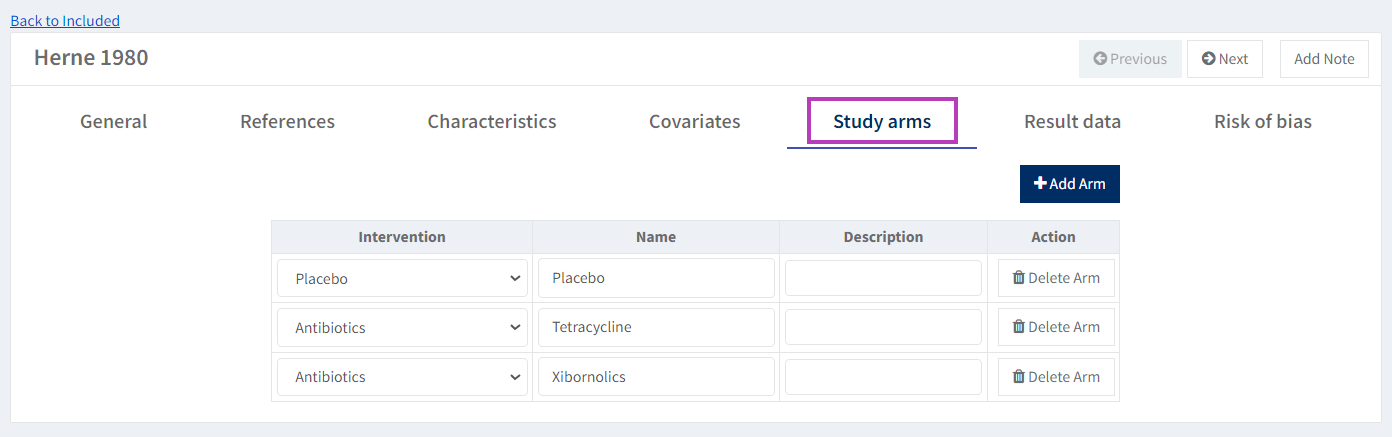
The study you are entering data for has three intervention arms: Xibornol, Tetracycline and Placebo. The former two intervention arms correspond to the 'Antibiotics' intervention you defined in the first step, while the latter corresponds to the Placebo intervention. You could choose to combine the first two arms manually, but it's better to let RevMan do this so that you have a record of the original extracted data.
Go to the Study arm tab. Click 'Add Arm' and choose 'Antibiotics' as the Intervention. For the 'Name', enter 'Xibornol' (overwriting the default name provided by RevMan).
Add the second arm by clicking 'Add Arm', and choose 'Antibiotics' as the Intervention again. For the Name, enter 'Tetracycline'.
Finally, click 'Add Arm' a third time and choose 'Placebo' as Intervention. Leave the default 'Name' as is.
4.b Enter the study's result data
After you have entered the study arms, go to the 'Result data' tab.
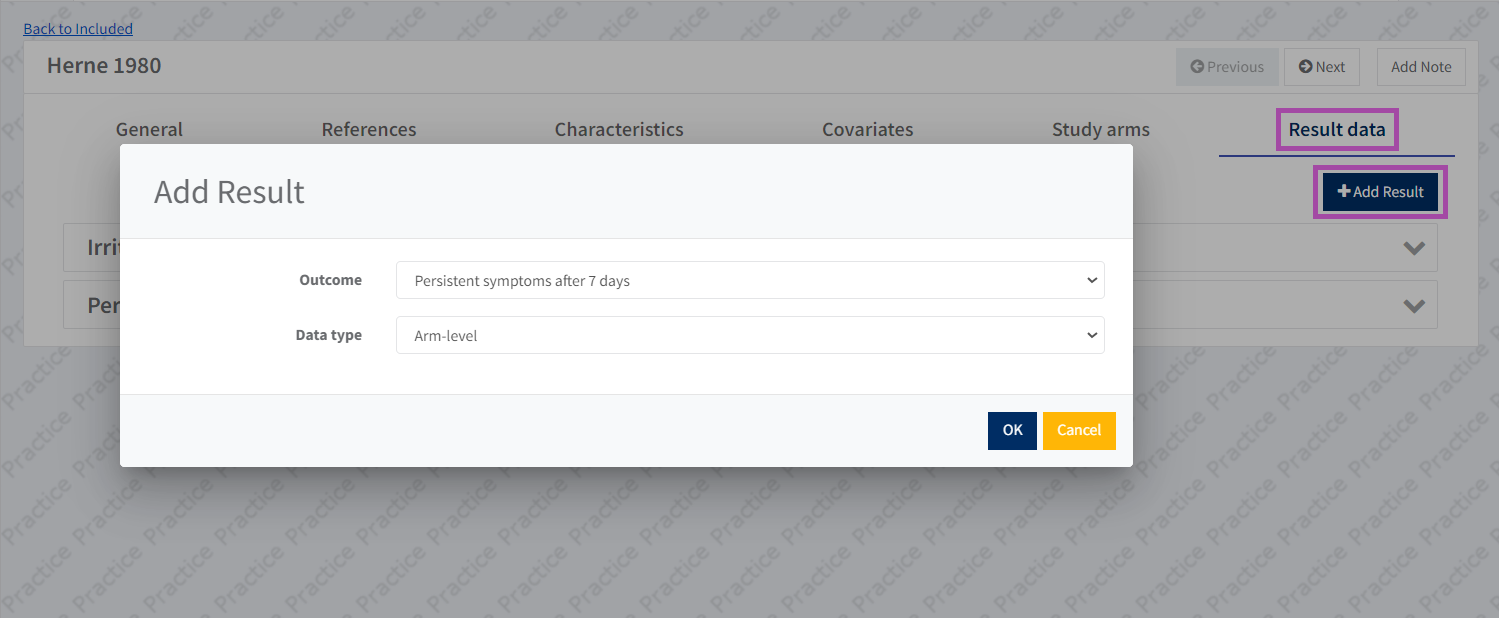
Click 'Add result' and select the outcome that you defined earlier from the Review Criteria > Outcome list and select what type of results data you will be entering.
Please note that when adding a result for contrast-level data, you will also need to specify the effect measure and reference arm.
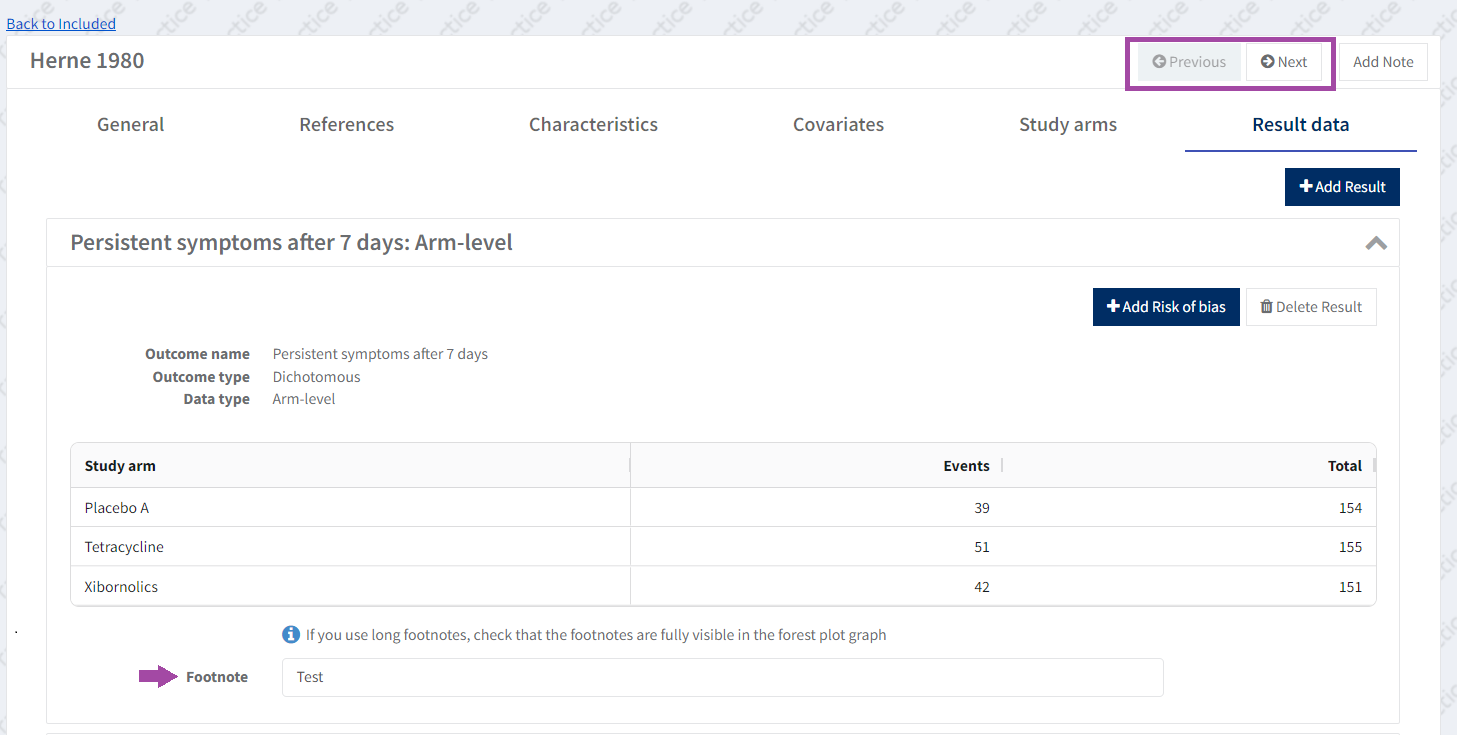
Adding a result will generate a table with one row for each of the study arms, and columns where you can enter the required result data.
In this case with arm-level data, it’s number of Events (participants with symptoms) and the Total (sample size) for each arm.
You can copy data from an external source (e.g. Excel, Notepad, Word) and paste it into the result data table as long as the data is in tabular form, i.e. separated by a tab rather than a space.
You can also copy the data from the result data table and paste it into an external file by selecting the data range that you want to copy and right-click to view the different options available.
You can export a result data table as a .csv or .xlsx file by right-clicking on any of the table cells and selecting Export.
More information is available to add a footnote to study centric results.
Move between the included studies to add the Study Arms and Results data analysis for each study using the navigation arrows.
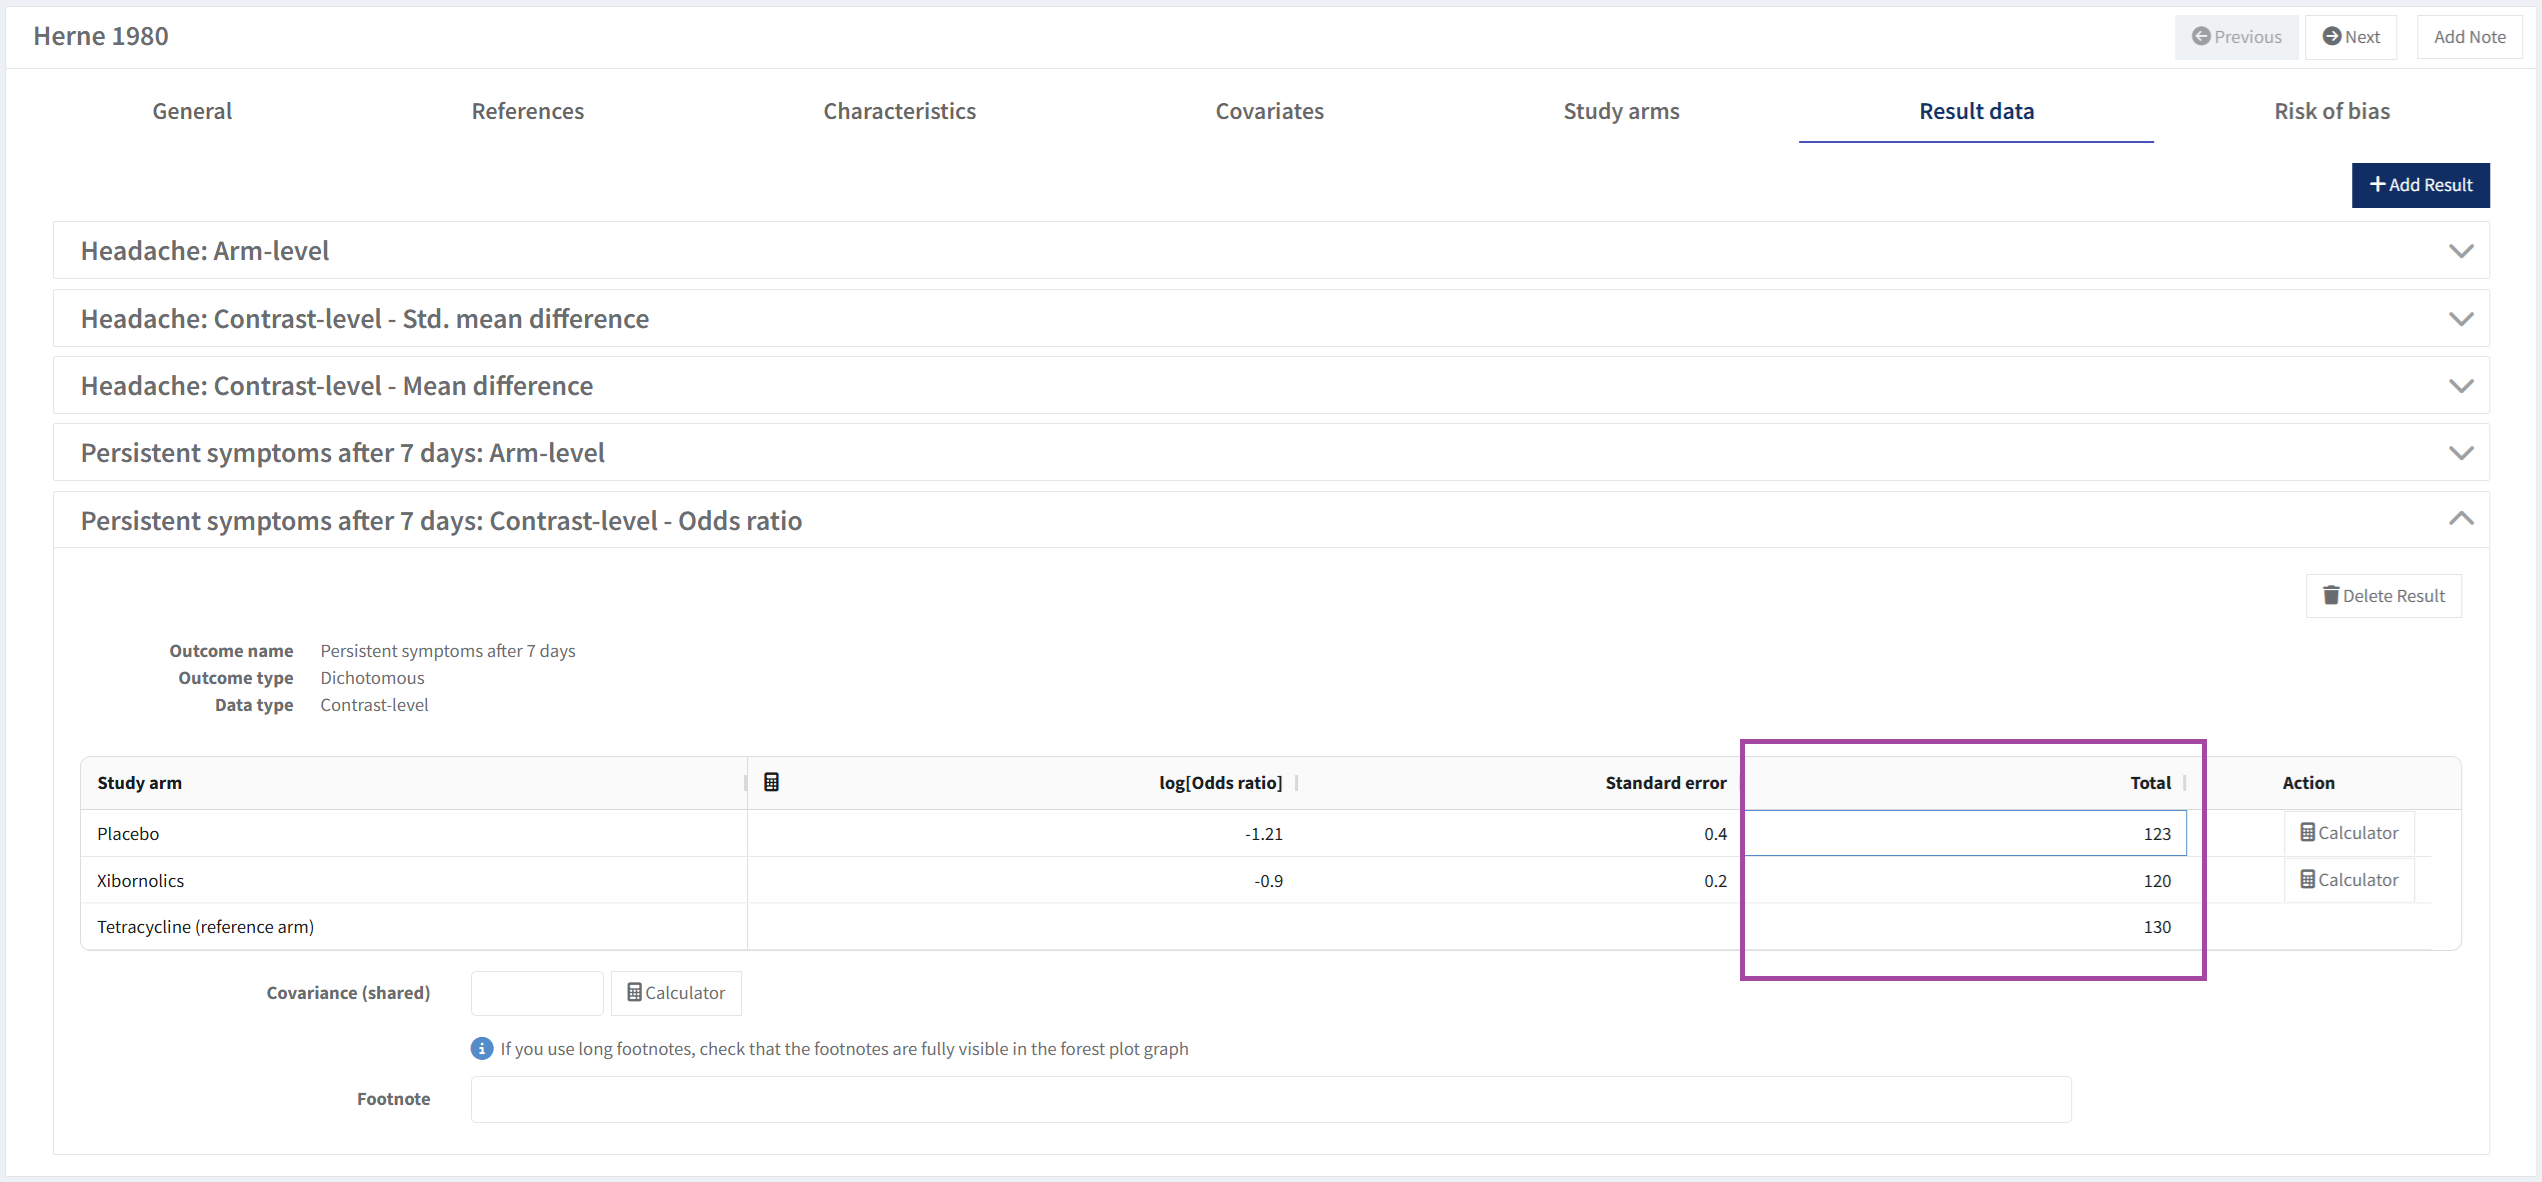
In this case with contrast-level data, it’s logOdds ratio and standard error for each contrast.
(Tetracycline vs Placebo): logOdds ratio -3.5 and the standard error 0.5
(Xibornolics vs Placebo): logOdds ratio -1.2 and the standard error 1
You can also choose to enter total number of participants for each arm for contrast data results. To display these in the analysis, enable the Show participant option described in analysis options.
4.c Add covariates to studies
If you predefined covariates for subgroup and sensitivity analyses (in Step 1), assign the relevant covariate categories to each included study.
The restriction is however that the studies only report one result per covariate in order to assign it. Currently, this is the only type of subgrouping and sensitivity analyses you can do with study centric data management.
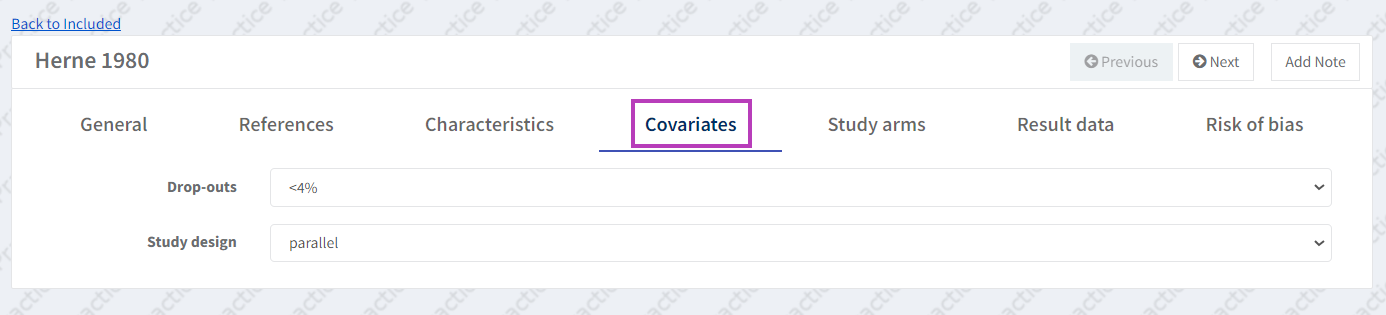
Assuming that all of our (already defined) studies fall into one of the two categories, go to the Covariate tab (still within the Included studies). You will see all your predefined covariates listed with dropdown options for the different predefined categories.
Move between the included studies to add Covariates for each using the Previous and Next navigation arrows.
5. Enter Risk of Bias assessment (Risk of Bias 1)
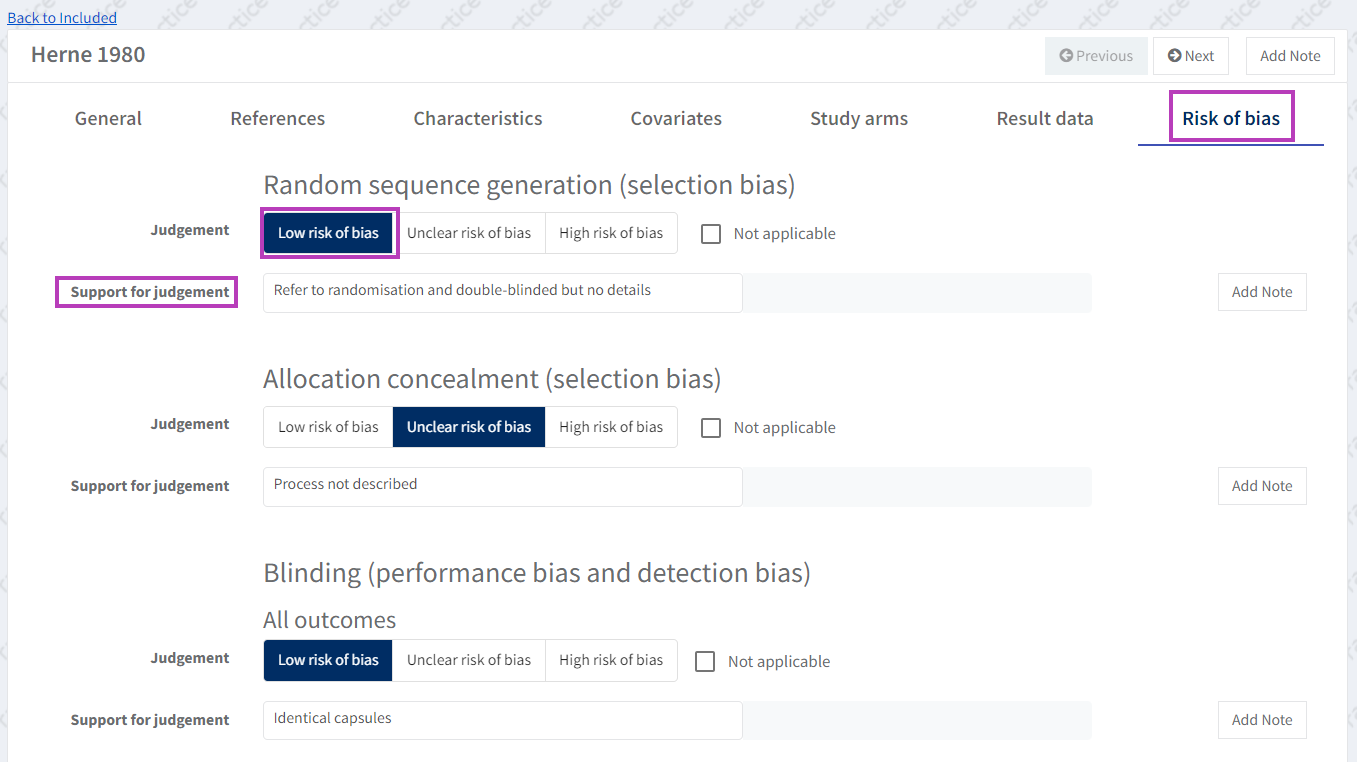
To edit the 'Risk of Bias' assessment, go to the study's 'Risk of bias' tab and make a judgement about the risk of bias for each domain.
You can also enter text to support your judgement. To edit the Risk of Bias items (domains) see Risk of Bias 1.
6. Enter Risk of Bias 2 data
6.a Enter Risk of Bias 2 data (not using study centric data)
If you are a Cochrane author, see Information for Cochrane authors before enabling RoB2. More information is available at Enable Risk of Bias 2.
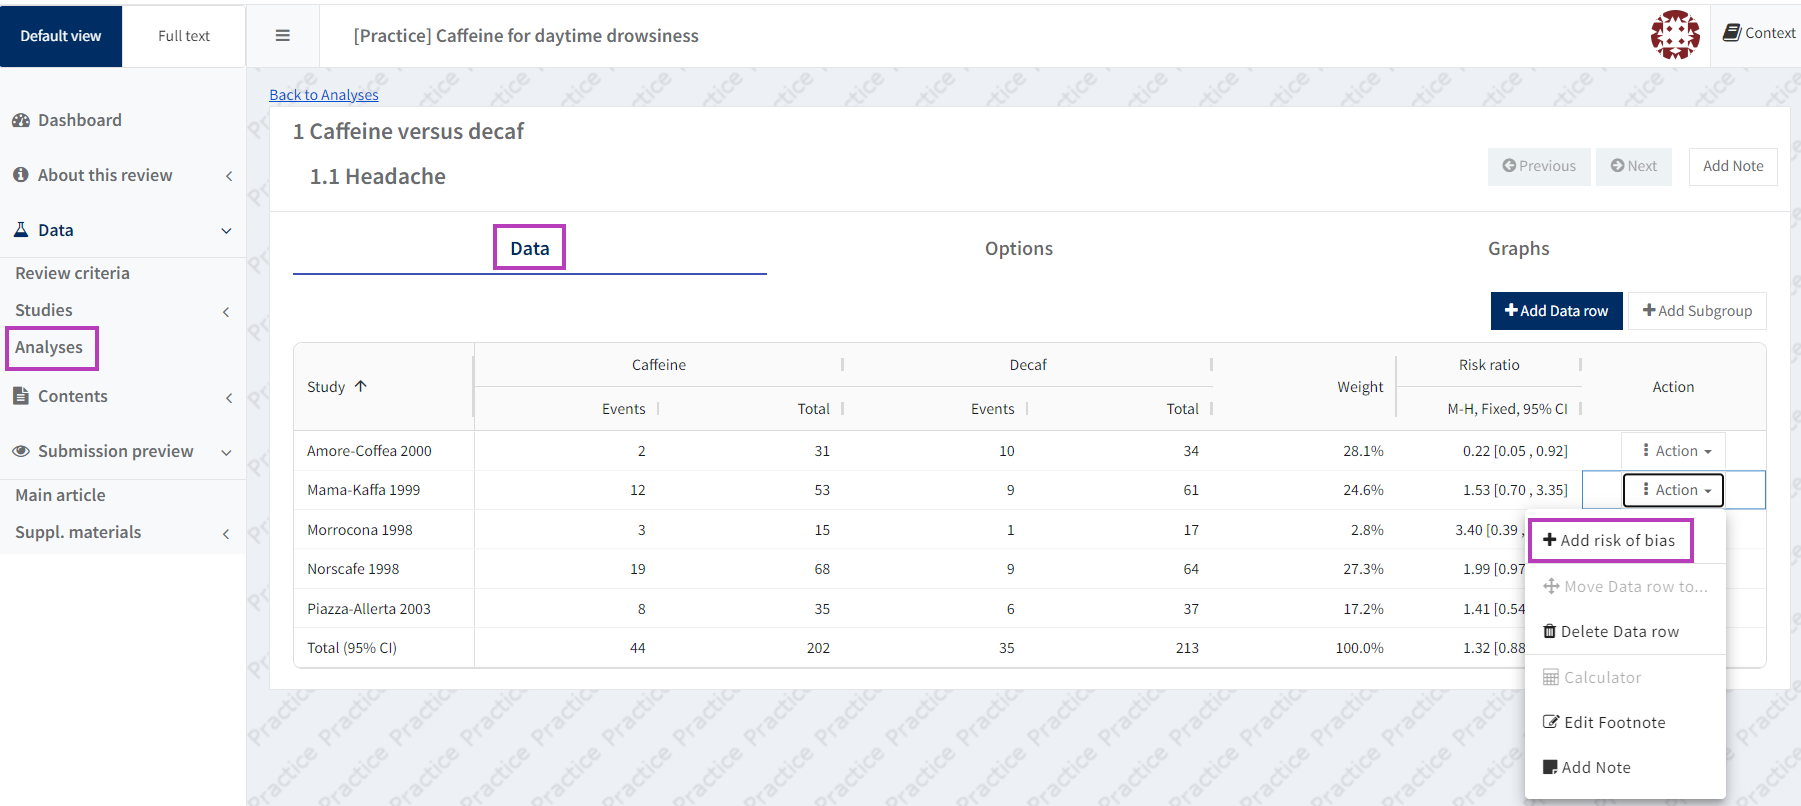
In the Analyses section, open the manual-input analysis for which you want to add RoB 2 data and select 'Edit analysis'. Next to each data row there is an 'Action' button. To add a Risk of Bias judgement for a particular result, click on the 'Action' button for the relevant study row to display the drop-down menu, then select 'Add risk of bias'.
Choose 'Edit risk of bias' from the data row action menu if you want to edit any RoB 2 assessments. If you wish to remove RoB 2 assessments, select 'Delete risk of bias'.
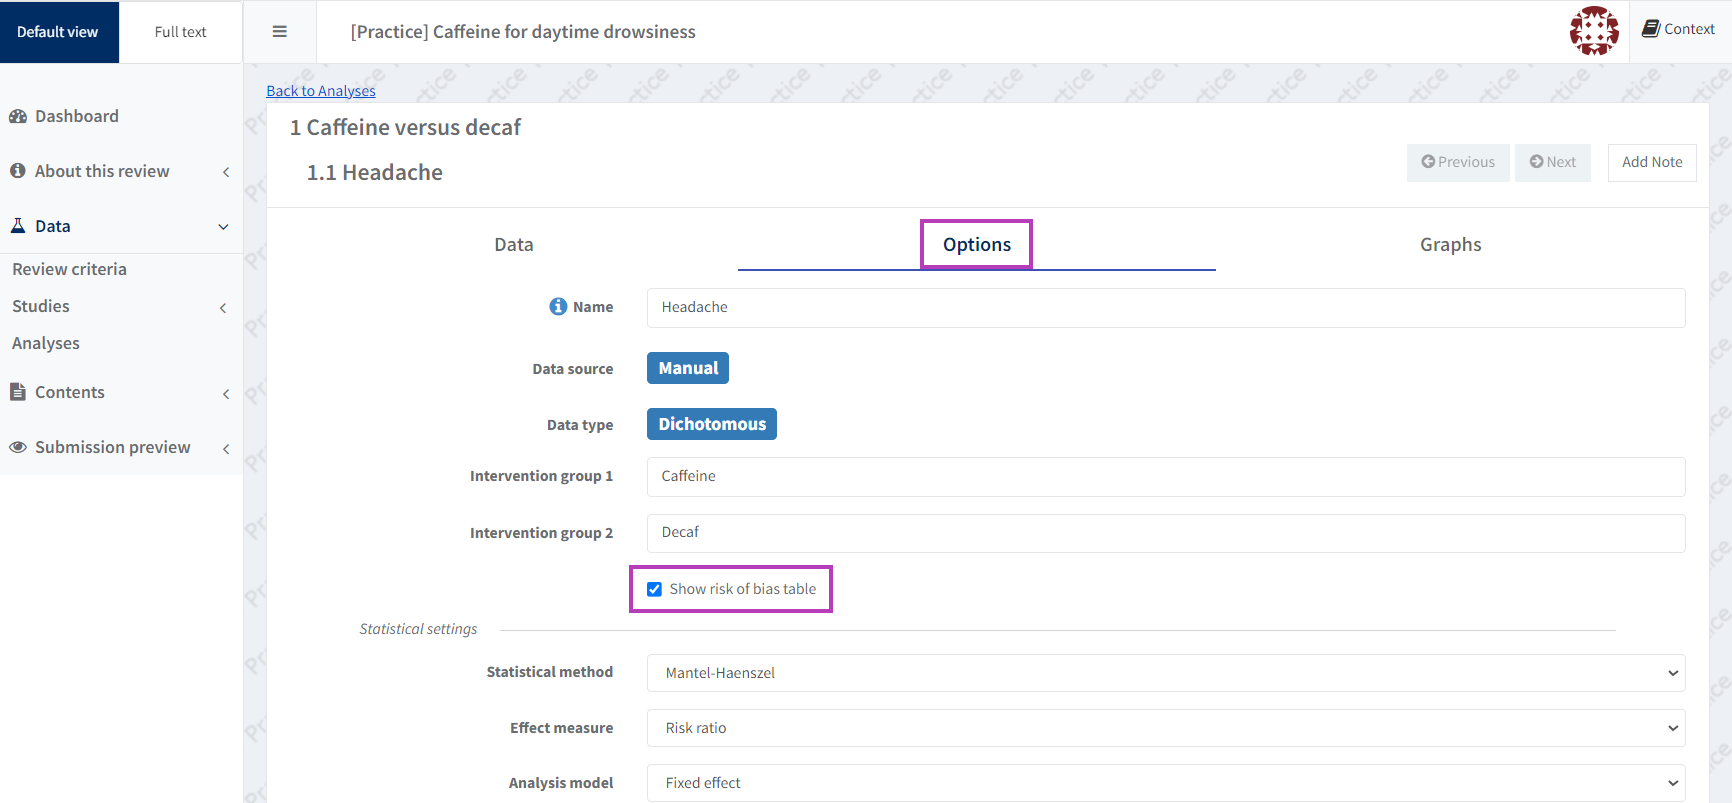
If the outcome in this analysis was pre-specified in the protocol for a Risk of Bias 2 assessment, ensure the ‘Show the risk of bias table’ box is checked in the ‘Options’ tab of the selected manual-input analysis.
This will create a results-level Risk of Bias table for this analysis, which includes all domain judgements and support for judgements for this outcome (see Set the analysis options).
6.b Enter the Risk of Bias judgements
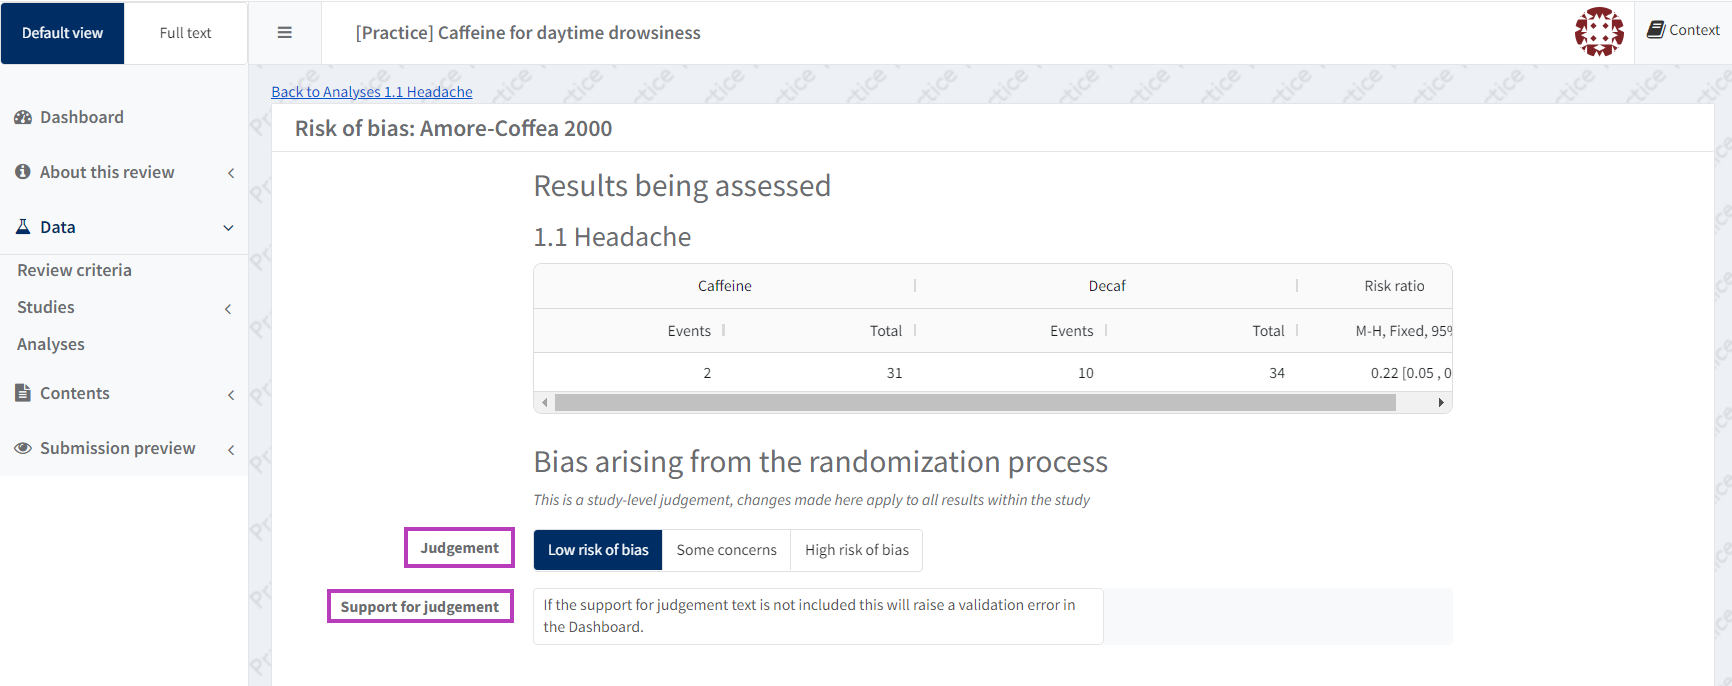
For each domain, make a judgement (low Risk of Bias, some concerns, or high Risk of Bias) and add supporting text. This information populates the results-level, RoB 2 tables and therefore must be completed.
The first domain (Bias arising from the randomization process) is study-level and all changes made for this domain will apply to all results within the study.
If the support for judgement text is not included this will raise a Validation Error in the Dashboard.
Please ensure you include the correct information in the support for judgement text box in RevMan. At the moment this needs to be done manually, i.e. there is no way to automatically transfer these judgements from a file or an application.
Note that the Risk of bias supplementary material displays the risk of bias assessment for each analysis in a table format. Consider this when reaching an overall judgement about risk of bias and provide the overall support for judgement. See the Risk of Bias full guidance document (Section 1.2.3, Table1) for guidance on providing support for judgement when reaching an overall risk of bias for an outcome.
In the left-hand navigation menu, go to Submission preview > Supplementary materials to preview how the Risk of bias supplementary material will look like in the published version.
6.c View the Risk of Bias summary graph
To view the graph summary of your Risk of Bias judgements, go back to the analysis and select the 'Graphs' tab.
Tick the 'Show Risk of Bias summary' box and then the Risk of Bias traffic lights will be added to the forest plot in the associated analysis section of the published review. It isn't necessary to create figures from an analysis as you can reference the relevant analysis within the review text.
If you have not entered the Risk of Bias judgements for some of the results, these are indicated by orange circles with exclamation marks.
6.d View the Risk of Bias table
Each outcome prespecified for RoB 2 assessments (likely to be the reviews’ critical and important outcomes included in the SoF table) should have a table that includes the Risk of Bias judgements (high, low or some concerns) and the supporting text for each judgement.
Please note that you cannot currently add footnotes to a Risk of Bias 2 table in RevMan.
Once you have created the main analysis, added the Risk of Bias 2 assessments and ticked 'Show risk of bias table' in the analysis options, you can view a version to see the risk of table.
In the generated view, scroll down to the ‘Risk of Bias’ section to view the results-level RoB 2 tables, which are located after the characteristics of studies section. The tables will only include the author judgements and support for judgements in text form, it is not possible to view the final table as it will be published in the Cochrane Library where the author judgements show as colour coded symbols linked to the support for judgement.
Please do not create the automated Risk of Bias figures in the Figures section of your review as these are only meant to be used with Risk of Bias 1 and are likely to be too large to publish.
6.e Duplicating the Analysis for a sensitivity or subgroup analyses that include the Risk of Bias assessments
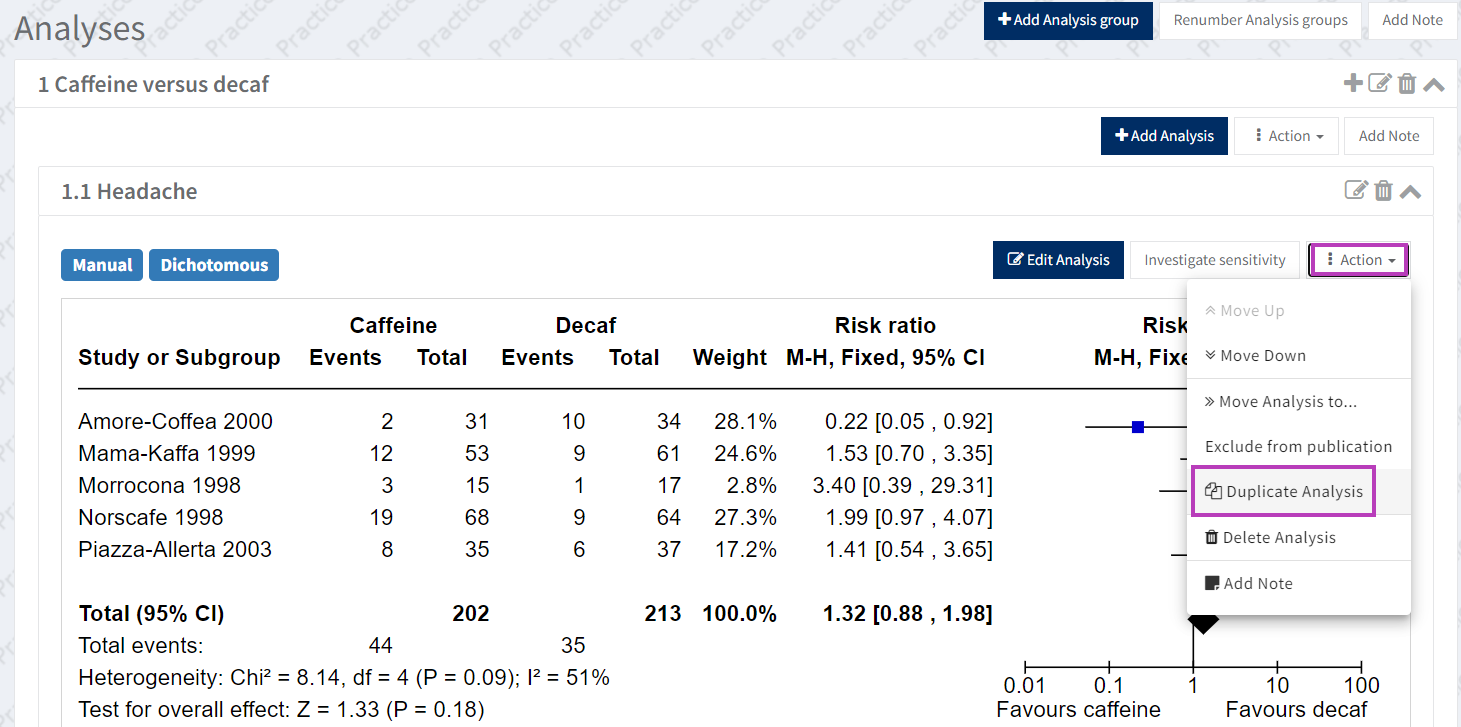
Once you have created the main analysis and added the Risk of Bias assessments, you can duplicate this for the sensitivity or subgroup analysis. This prevents you from needing to re-input the data and Risk of Bias assessments.
To duplicate your analysis, open the analysis and click on the analysis ‘Actions’ button. Select ‘Duplicate Analysis’ and choose the destination analysis group.
Please note that it is not possible to store two sets of RoB 2 assessments for a single study, if for instance, a study with two subgroups has different RoB 2 assessments for each of the subgroups. There will be only one set of RoB 2 judgements available per subgroup.
Go to the new analysis and select 'Edit analysis' to make changes. Go to the ‘Options’ tab to edit the name of the analysis. To remove the studies that you don’t want to be included in that sensitivity analysis,go to the ‘Data’ tab and select ‘Delete data row’ from the relevant data row 'Actions’ button. There is more information in this Knowledge Base on ‘sensitivity analysis’ and ‘subgroup analysis’.
6.f Delete a Risk of Bias assessment
If there is an analysis or study for which you would like to remove the Risk of Bias assessment, there are two ways to do this.
- If you do not want a Risk of Bias assessment to publish for a full analysis, you can uncheck the 'Show risk of bias table' for that specific analysis. To do so, go to the analysis, select 'Edit analysis' and go to the 'Options' tab.
- If you wish to delete the Risk of Bias assessment for a particular study (e.g., if you copied created the analysis by duplicating another analysis for which Risk of Bias was already determined, but it is not relevant for that analysis), select the study and click on the 'Action' menu, then select 'Delete risk of bias'.