Automatic (SCD) analyses
Study centric data management is Cochrane’s recommended approach to data management in intervention reviews (since April 2023). See When should I use study centric data management?.
How are study centric data analyses generated?
Study centric data analyses are generated by RevMan based on the analysis setup. Depending on the data source, outcome, interventions, subgrouping or sensitivity filters, and the available data, RevMan will identify which results to include.
To optimize the amount of data to include, RevMan will automatically transform the result data with the following operations:
- Combine study arms when two or more study arms map to the interventions selected for the analysis (available for both contrast and arm level data)
- Transform arm level data to contrast level data when including both arm and contrast level data in an analysis
- Switch reference arm when a study reports the contrasts A-B and A-C were reported and you are interested in the contrast B-C.
A result will only be included if there is enough data available. When you are setting up subgroup or sensitivity analyses, you will need to have the covariates specified in advance. See Add covariates for subgroup and sensitivity analyses.
View a complete explanation of how study centric analyses are generated.
Create an analysis using study centric data
It is recommended that analyses are set up at the protocol stage before entering any study results data. This enables you to check that you have included the interventions, intervention groupings, outcomes and covariates within the review criteria correctly. It also means that once you import your results data, your analyses will be automatically populated (a key benefit of using study centric data management).
After setting up the review criteria, follow the instructions to add analysis groups and analyses. Select 'Automatic' when you are prompted to choose between creating an analysis based on study data or manually entered data. Then, set the analysis options.
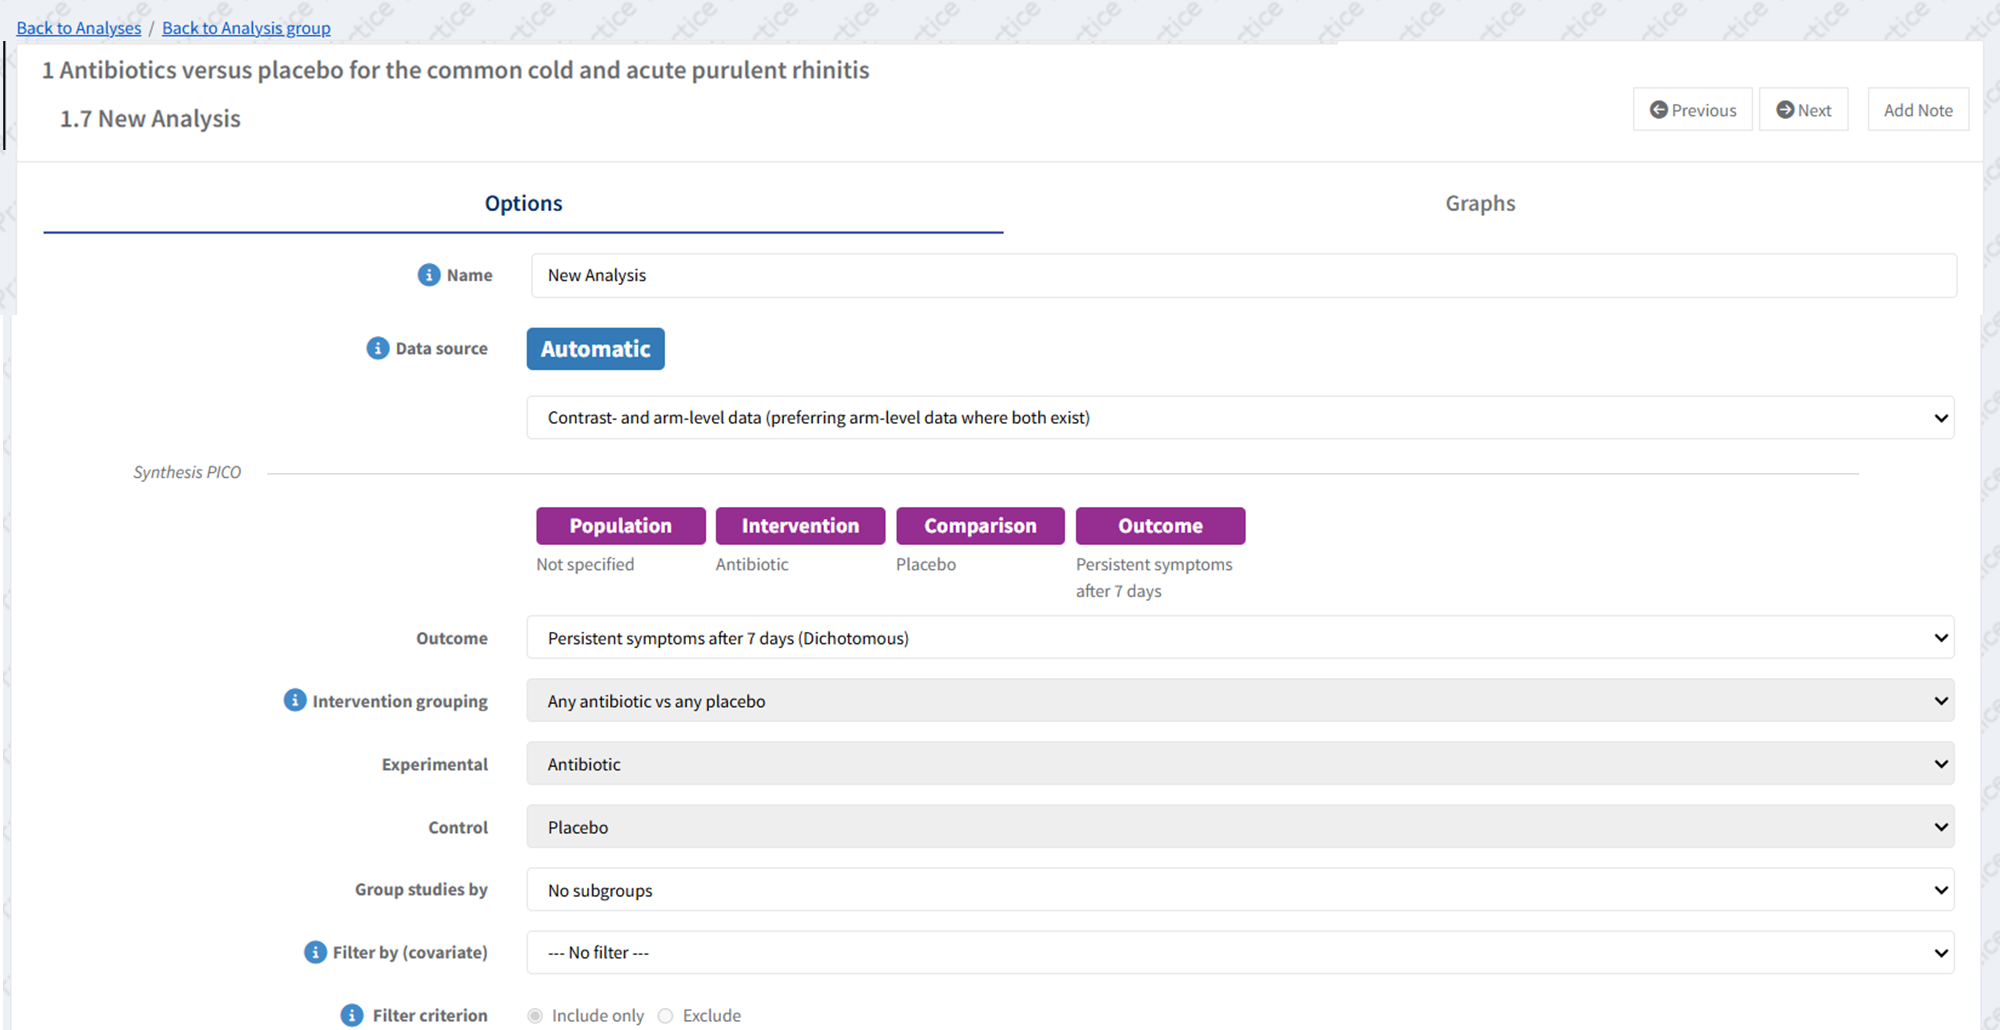
Define the name of the new analysis and data source
In the ‘Options’ tab of the new analysis, enter the analysis name -in this case it makes sense to just enter the outcome name-, then select the data source.
The data source relates to the types of results data to include in your analyses, with the options:
- Only arm-level data
- Only contrast-level data
- Contrast- and arm-level data (preferring arm-level data where both exist)
- Contrast- and arm-level data (preferring contrast-level data where both exist)
For more information about the data source for automatic analyses, see Arm vs Contrast level data.
Section 5.3.6 of the Cochrane Handbook for Systematic Reviews of Interventions provides more guidance on the different types of data and in what circumstances either might be preferred in your analyses.
Set the Synthesis PICO
In the ‘Options’ tab of the new automatic analysis, under Synthesis PICO, choose your:
- Outcome
- Intervention grouping (for broader synthesis questions)
- Experimental grouping (for narrower synthesis questions)
- Control grouping
You can also set the intervention, experimental and control grouping at analysis group level. This will set these options for all analysis in that group . See more information on Set Interventions.
The example shows a broader synthesis question using intervention groupings.
It includes:
- 'Persistent symptoms after 7 days' as the outcome.
- 'Antibiotics' (all antibiotics) as the experimental intervention.
- 'Placebo' as the control intervention. None of the following examples subgroup or filter for sensitivity analyses, so these options are left as default.
When using an intervention grouping like this to define a comparison, it is useful to name the grouping with a description of the comparison - "Any antibiotic vs any placebo" in this example.
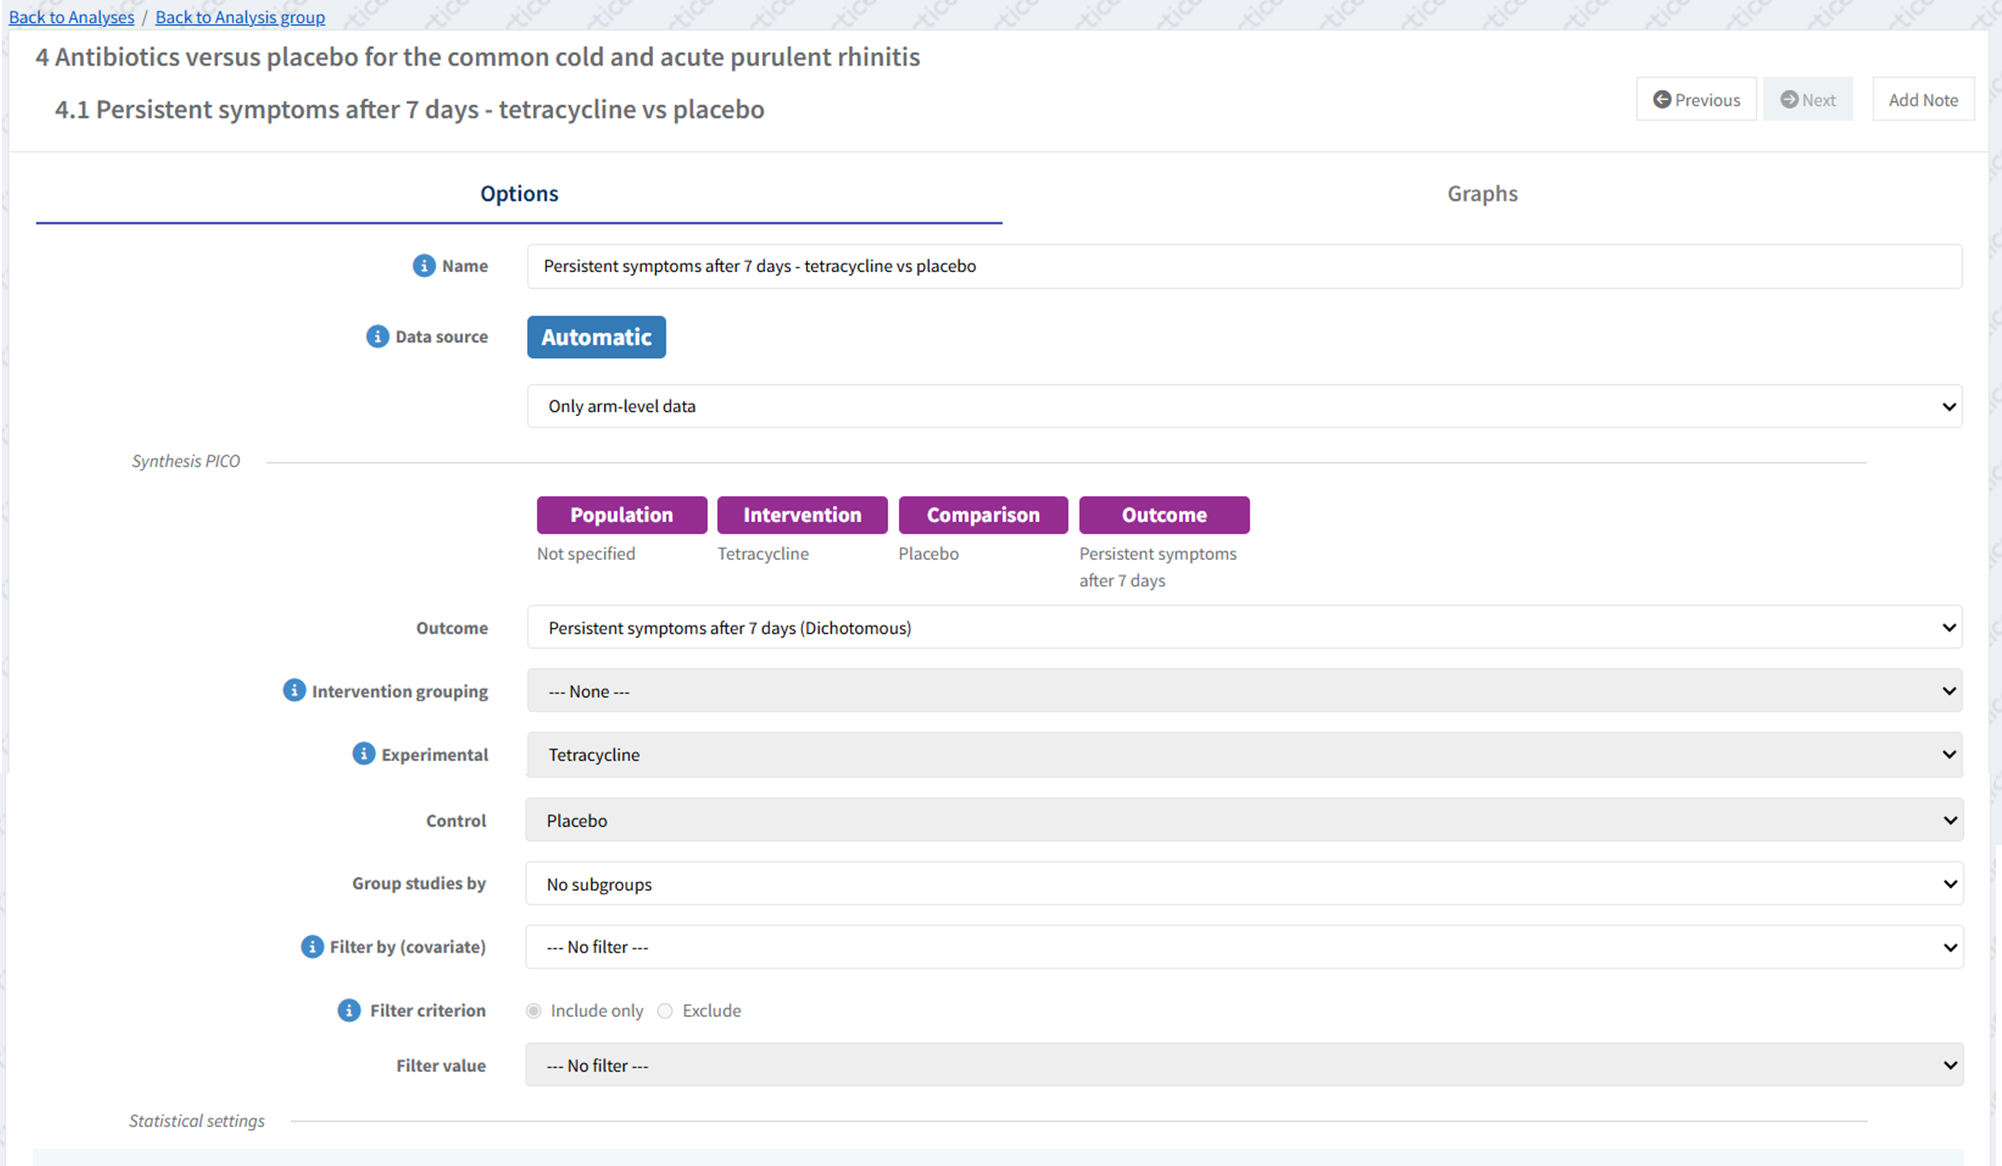
The example shows a narrower synthesis question using the more granular interventions based on a specific antibiotic versus placebo.
It includes:
- 'Persistent symptoms after 7 days' as the outcome.
- 'Tetracycline' as the experimental intervention.
- 'Placebo' as the control intervention.
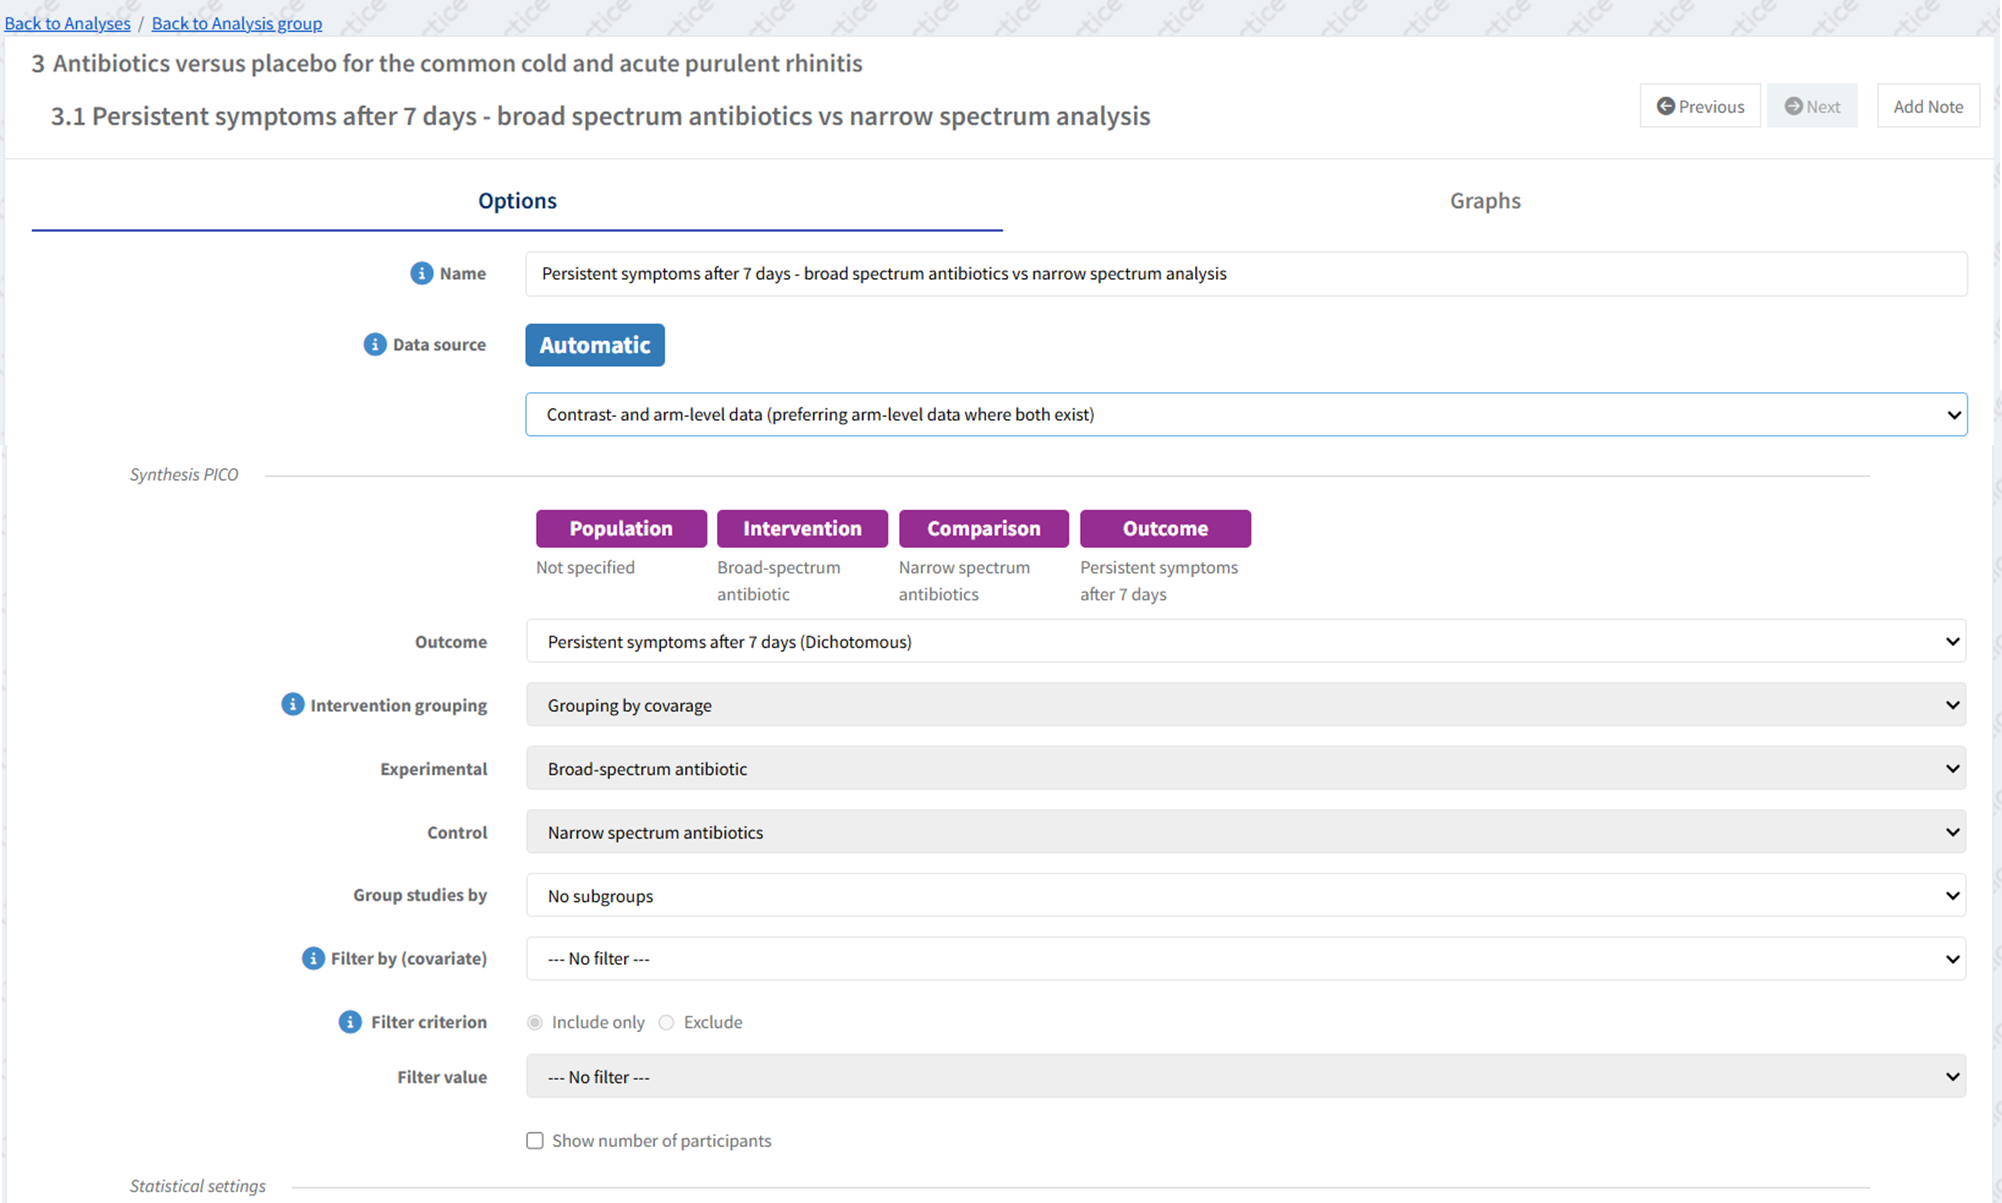
The example shows a narrower synthesis question using the more granular interventions based on antibiotic coverage.
It includes:
- 'Persistent symptoms after 7 days' as the outcome
- 'Broad-spectrum antibiotic' as the experimental intervention
- 'Narrow spectrum antibiotics' as the control intervention.
Add a footnote to study-centric results
You can enter a footnote for each study-centric result, which will appear on the forest plot of the automatic analysis.
Find the included study and the result for which you want to add a footnote. Select 'Edit study' and go to the ‘Result data’ tab.
A text box for adding a footnote is available in each result panel.
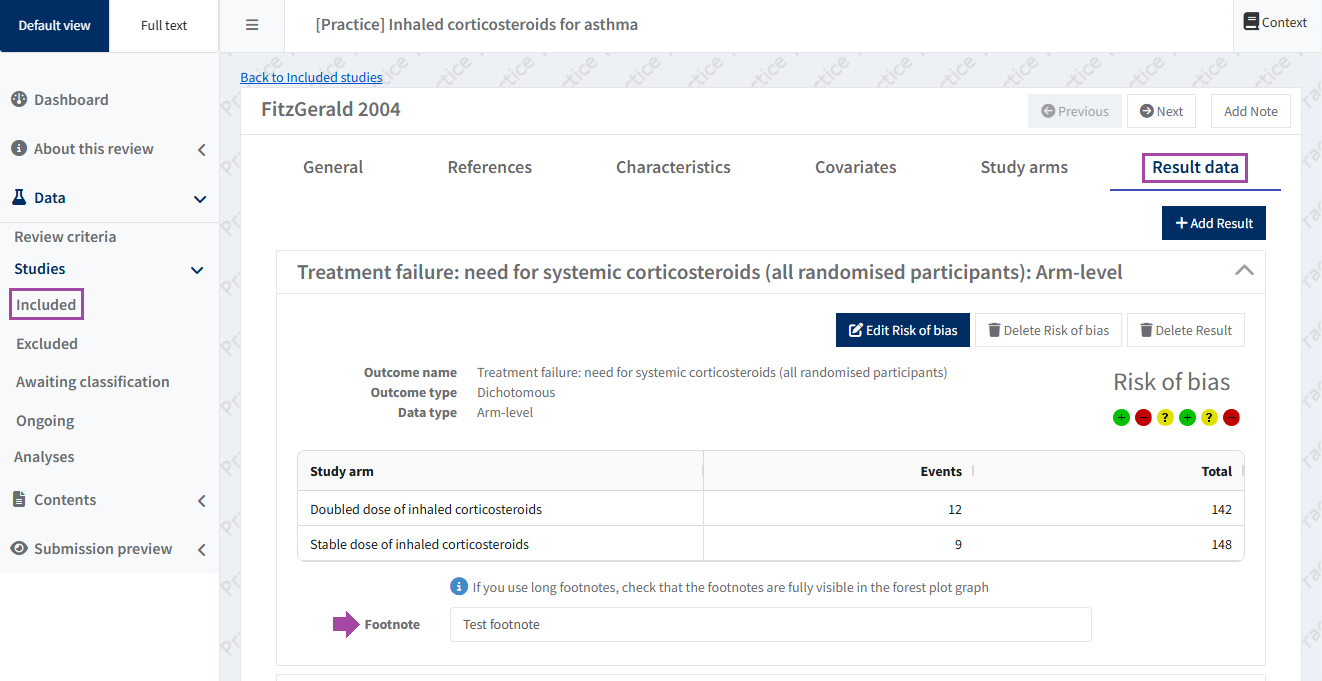
Footnotes will be displayed in the forest plot for each analysis where the result is included. If an analysis has the same footnote more than once, they will be combined into a single footnote with a single index.
Once you have entered the footnotes, check how they will appear in the forest plot to ensure that they are fully visible by previewing your submission or viewing a version.
Please keep footnotes as concise as possible and check that they are fully visible in the forest plot graph.
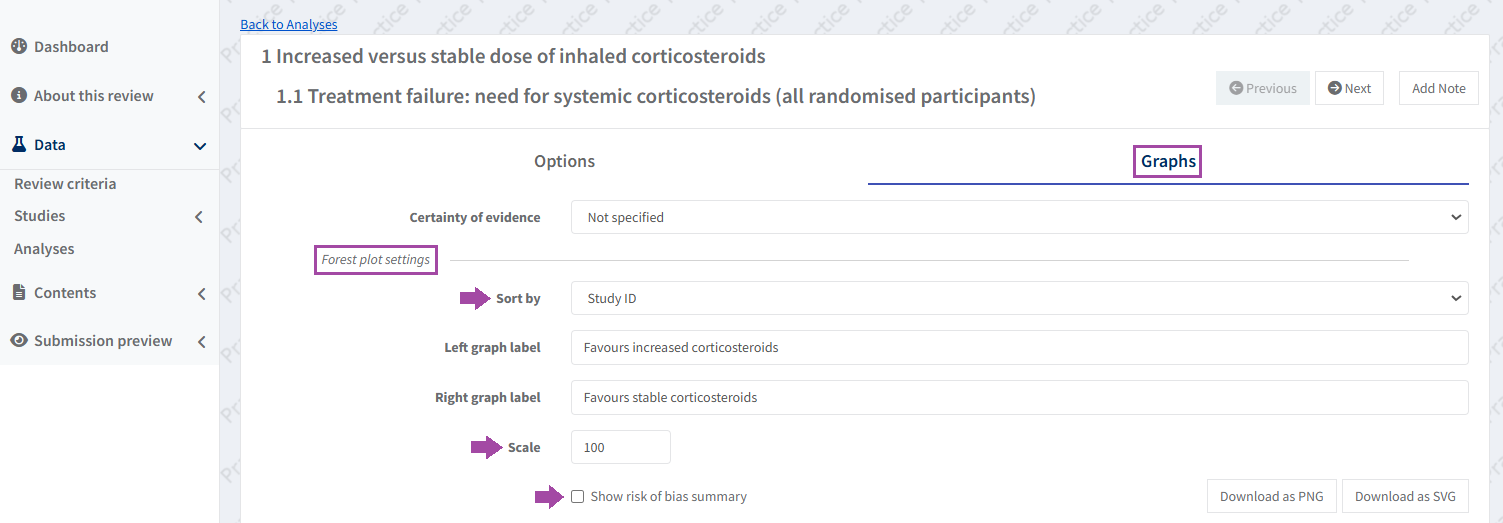
Forest plot settings
The published review will display the forest plot based on the forest plot settings defined in each analysis ‘Graphs’ tab.
Once you have created and set up your analysis, go to the 'Graphs' tab to adjust how the forest plot is displayed.
You can sort studies by study ID, year of study, weight, effect size, or risk of bias item.
The scale is set to 100 by default, but you can change it to optimize the presentation of your results if needed.
If you want to include the risk of bias summary in the forest plot, select ‘Show risk of bias summary’.