Pre-define analyses
Study centric data management is Cochrane’s recommended approach to data management in intervention reviews (since April 2023). See Study centric data management.
Types of analyses in RevMan
There are two ways to set up an analysis in RevMan:
Using study data (recommended): All studies with results for the selected outcome and interventions will be included in the analysis. Data are entered and stored at the included study level and can be re-used across different analyses. See When should I use study centric data management?.
Using manual input: Manually choose which studies are included in the analysis. Data are entered and stored specifically for this analysis and cannot be re-used across different analyses. See manual-input analyses.
Create analysis groups and analyses
It is recommended that authors set up their analyses at the protocol stage: plan in advance what statistical methods will be used to synthesize results. See Standard C21 ‘Planning the synthesis of results’ of the MECIR Manual.
Add a new analysis group
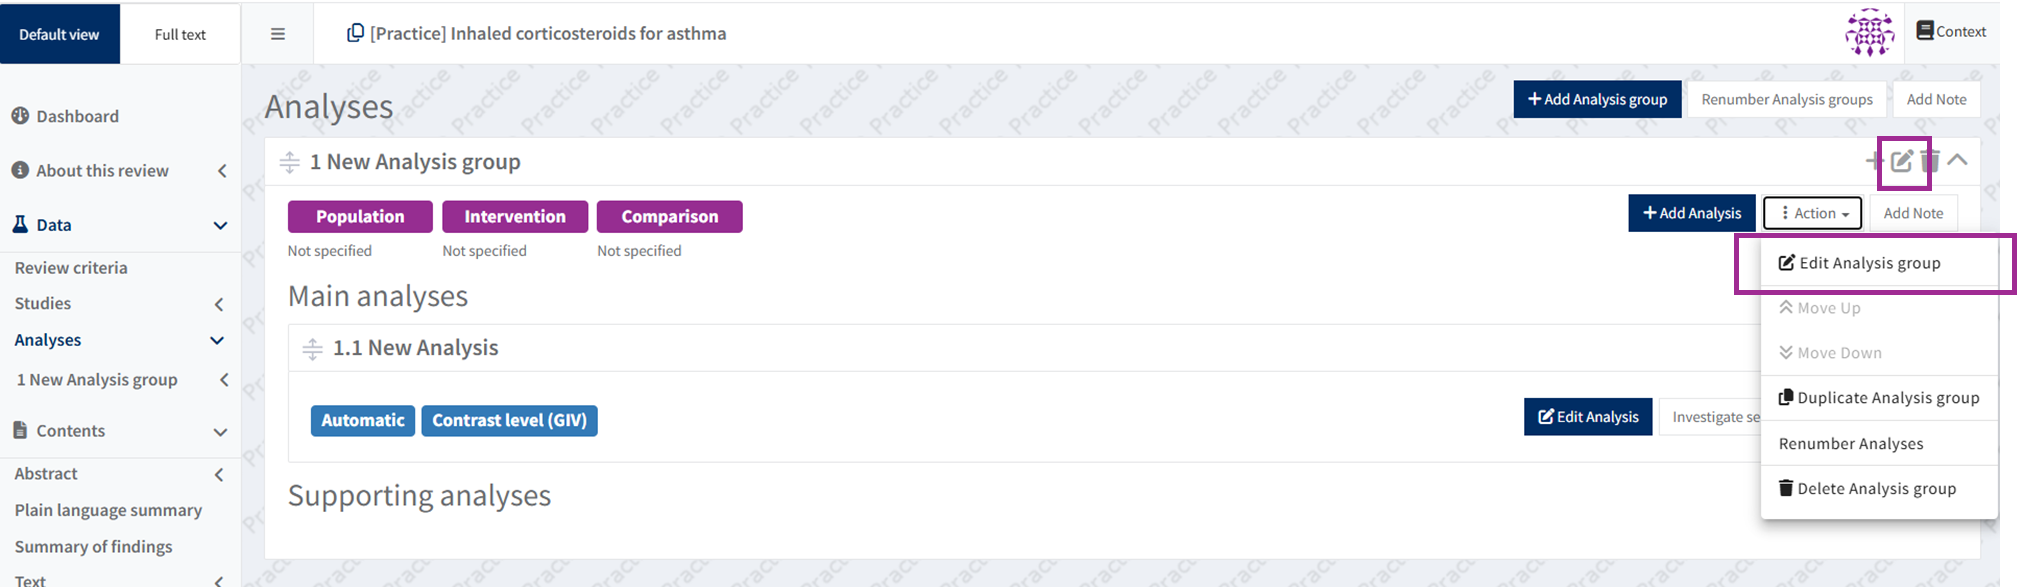
To add an analysis group, go to the Data section of the left-hand menu in RevMan, then to Analyses. Select Add analysis group and enter the name of the new analysis group.
See Add a new analysis to add the first analysis to this analysis group.
Then select Back to analysis group to return to the Analyses section, or use your browser back button.
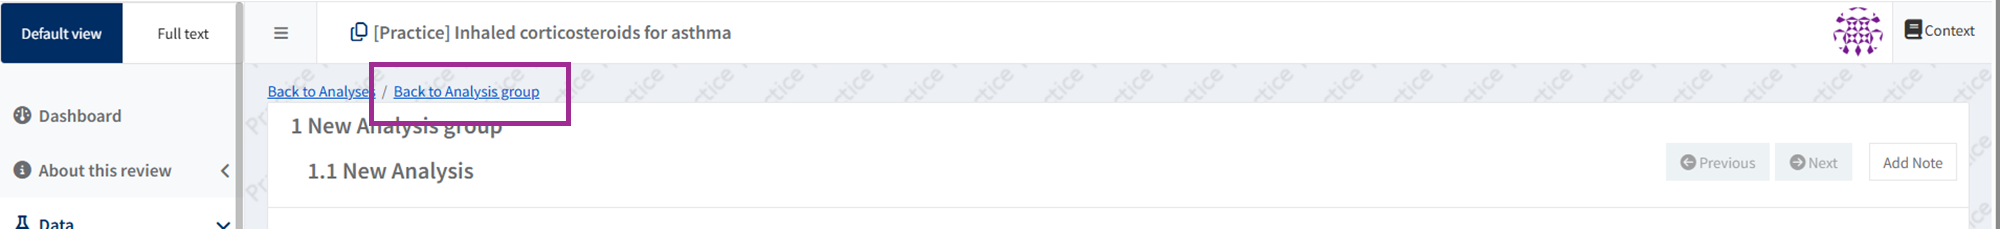
Select Edit analysis group or the pencil icon to add graph and group labels for all analyses within the same analysis group.
Set interventions
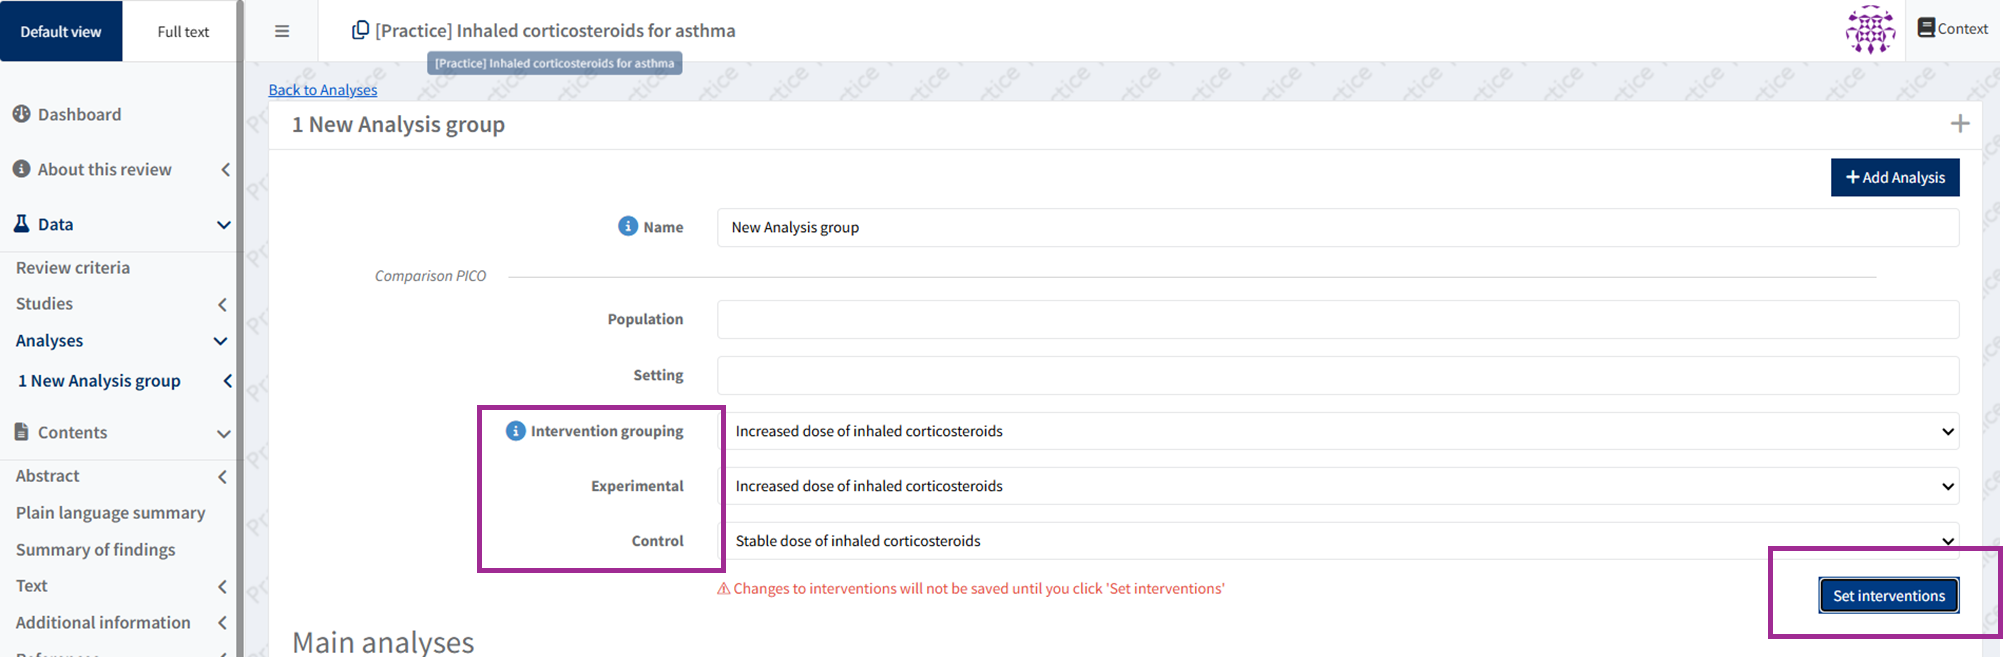
You can set your interventions at group level. This will then be applied to all analyses in that group.
Select your experimental intervention and control intervention, then press Set interventions. These will now be saved for all analyses in that group.
For existing analysis groups the interventions will be blank until you complete them and press Set interventions. If you complete them and don't press Set intervention they will be blank the next time you open the analysis group.
The Set intervention button will be greyed out if you have not selected a experimental intervention and control intervention.
Once you select Set interventions there is a warning advising this can not be undone. If you want to the option to revert these changes you should tag a version before setting your interventions.
Add a new analysis
The first analysis can be added directly from the analysis group editing interface after entering the analysis group name, or alternatively, using either the ‘+’ icon or Add analysis on the Analyses main page.
Select Add analysis to create a new analysis.
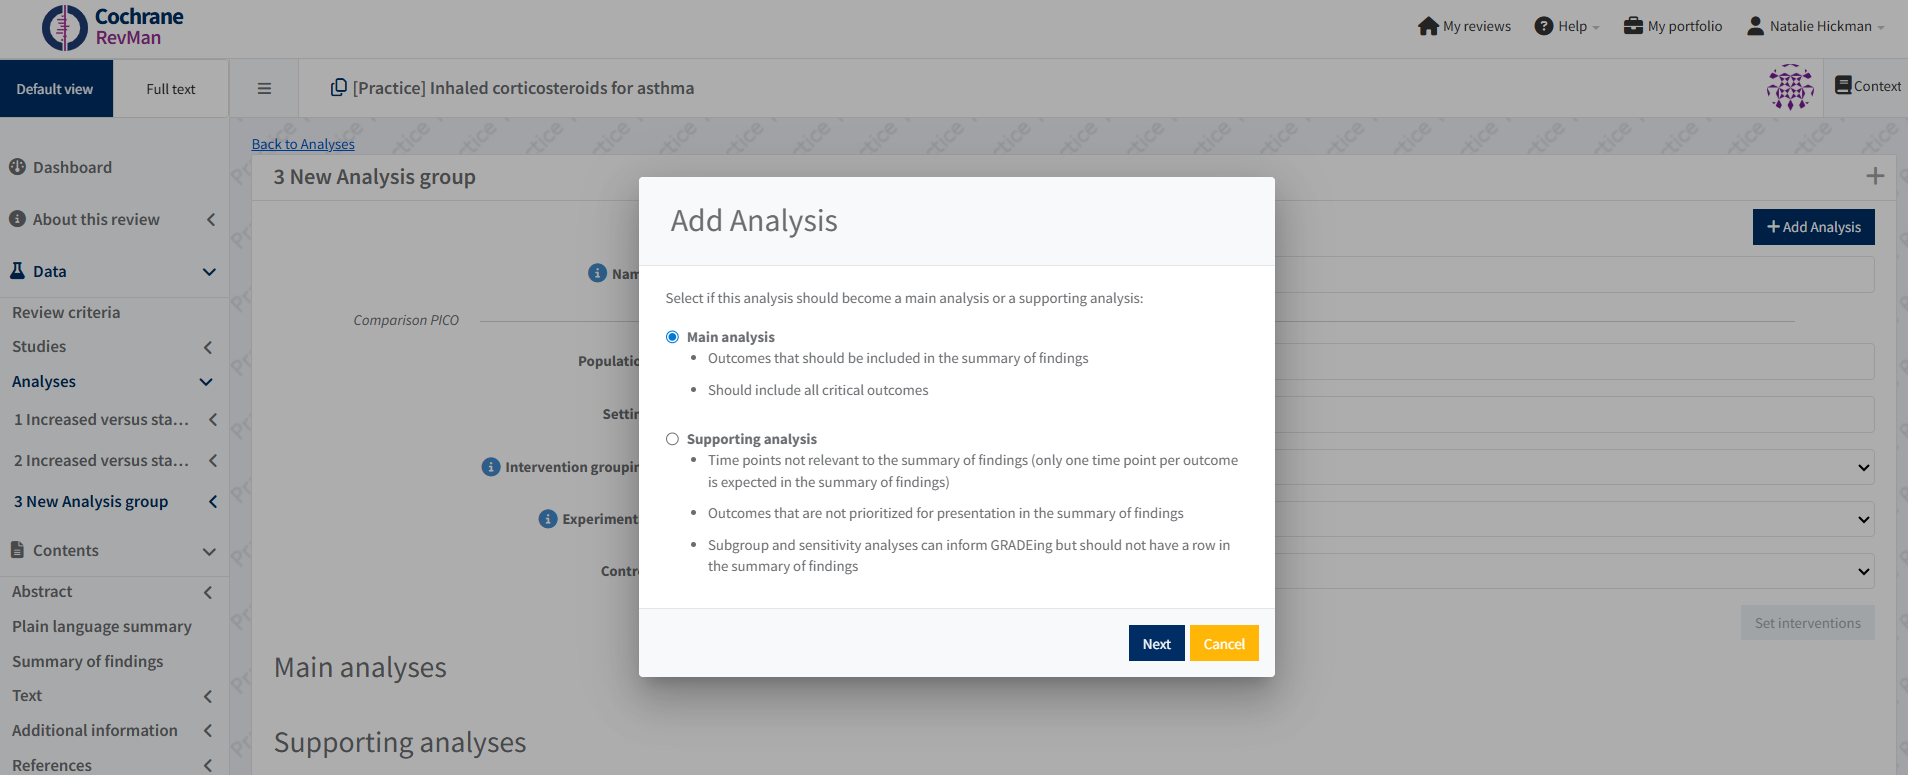
Select to add the analysis as either a Main analysis or a Supporting analysis.
- Main analysis
- Outcomes that should be included in the summary of findings
- Should include all critical outcomes
- Supporting analysis
- Time points not relevant to the summary of findings (only one time point per outcome is expected in the summary of findings)
- Outcomes that are not prioritized for presentation in the summary of findings
- Subgroup and sensitivity analyses can inform GRADEing but should not have a row in the summary of findings
Select Next.
You will then be prompted to choose between two options for creating the analysis:
- Automatic: create an analysis based on the synthesis criteria (automatic). RevMan will automatically include all study data for the selected outcome and interventions. See Automatic (SCD) analyses.
- Manual: create an analysis where you can enter study data specific to this analysis manually. See Manual-input analyses.
Reorder analysis
Existing analyses will automatically be grouped under Main analyses. If you move or duplicate an analysis from another analysis group it becomes a supporting analysis.
To move an analysis from 'main' to 'supporting', or vice versa, drag and drop it using the arrows beside the title, or select Action then Move to Supporting analyses/Move to Main analysis.
To reorder analyses within the same group, use the drag and drop arrows located to the left of your analysis title. Or select the Action menu then Move Up or Move Down.
To move an analysis to a different analysis group, open the the analysis you want to move, then the Action menu and Move Analysis to. Select the destination analysis group and your analysis will wove to that group under Supporting analyses. You can then drag and drop it to main analyses if required.
If you are creating new tables using the GRADEpro integration, you will need to remove supporting analyses from the SoF.
Set the analysis options
It is recommended that authors set up their analyses at the protocol stage: plan in advance what statistical methods will be used to synthesize results. See Standard C21 ‘Planning the synthesis of results’ of the MECIR Manual.
More information about data type and effect measures is available in Chapter 6.1 of the Cochrane Handbook for Systematic Reviews of Interventions.
More information about data analysis and conducting meta-analyses is available in Chapter 10 of the Cochrane Handbook for Systematic Reviews of Interventions.
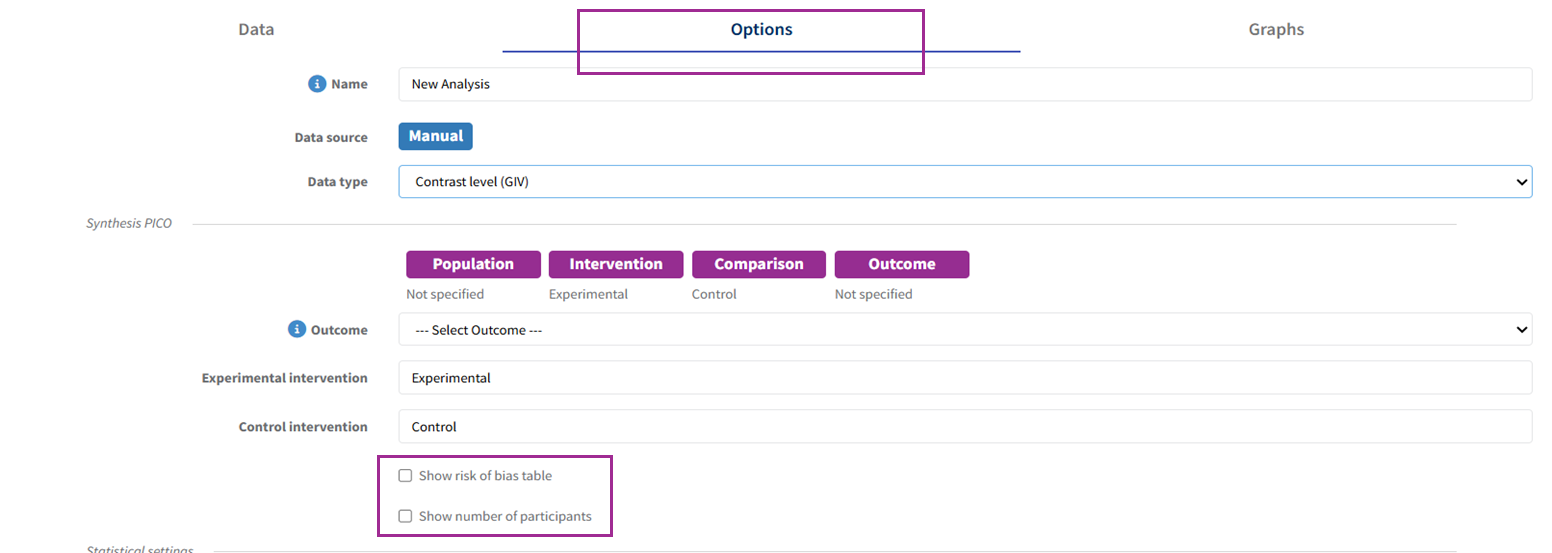
Use the 'Options' tab of the analysis to set the options for the meta-analysis, including the data type (manual) or data source (automatic), the statistical method, effect measure, analysis model, how the results are presented, and the level of confidence/prediction intervals.
Subgroup differences
If you are doing a subgroup analysis, the option to test for subgroup differences is selected by default. However, subgroups are configured differently depending on whether the analysis is automatic or manual.
- See Subgroup analyses if you are using study data.
- See Manual subgroup analyses if you are using manually entered data.
Show risk of bias table
If the outcome in the analysis was pre-specified in the protocol for a Risk of Bias 2 assessment, select the option ‘Show risk of bias table’ to display all domain judgements and support for judgements for this outcome next to the forest plot. This option is only available if Risk of Bias 2 is enabled in your review.
Ticking 'Show risk of bias table' will mean that the analysis table is also included in the Risk of bias Supplementary materials.
For GIV analyses (manual) and automatic analyses that include contrast results, you can choose to 'Show number of participants'. This will display the number of participants in the forest plot data table if they have been entered.
The image shows an example of manual analysis options.
See Automatic (SCD) analyses and Manual-input analyses for differences based on the analysis type.
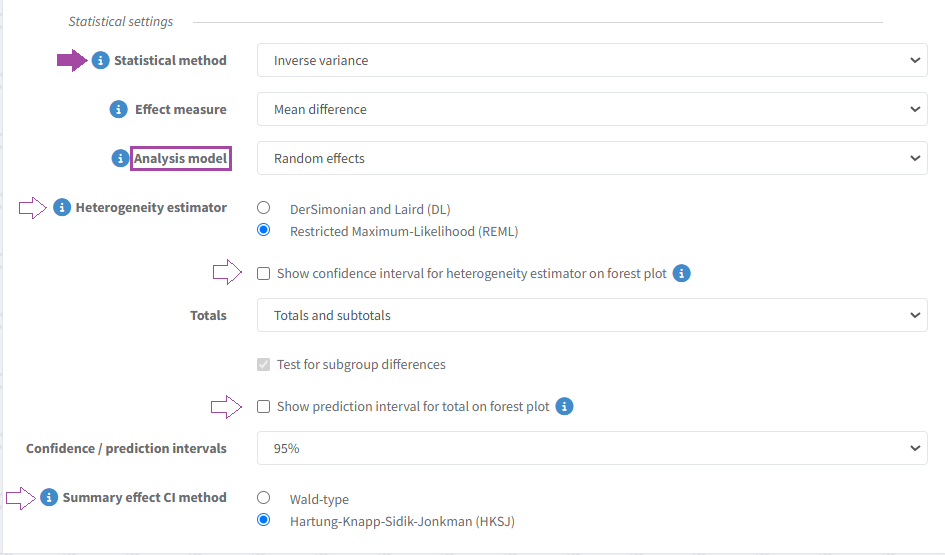
Statistical settings for random effects analyses
In analyses where the analysis model is random effects, the analysis statistical method is automatically set to inverse variance.
Guidance on how to set the statistical parameters for a random-effects analysis is available in the simplified methods explainer from the Methods Support Unit.
Heterogeneity estimator
In new random effects analyses, the default heterogeneity estimation method is ‘Restricted Maximum Likelihood' (REML). However, if the statistical method is changed from 'inverse variance' to ‘Mantel-Haenszel’, the heterogeneity estimator will change to ‘DerSimonian and Laird' (DL).
To display the confidence interval for the heterogeneity estimator on the analysis graph, select the corresponding option in analysis statistical settings.
More information on heterogeneity is available in Section 10.10 of the Cochrane Handbook for Systematic Reviews.
Prediction interval
The prediction interval can be displayed on the forest plot by selecting the corresponding option in the analysis statistical settings. When enabled, the prediction interval is displayed in the analysis graph, numerically below the total and graphically on the forest plot (for totals only).
More information on prediction intervals from a random-effects meta-analysis is available in Section 10.10.4.3 of the Cochrane Handbook for Systematic Reviews of Interventions.
Summary effect confidence interval
It is possible to choose the method to calculate the analysis total summary effect CI: ‘Hartung and Knapp, Sidik and Jonkman (HKSJ)’ distribution or ‘Wald-type’ (normal) distribution.
In new random effects analyses, the default summary effect CI method is Wald-type.
More information on implementing random-effects meta-analyses is available in Section 10.10.4.4 of the Cochrane Handbook for Systematic Reviews of Interventions.