Check your analyses
Related pages: Report analysis results
Once your Analyses are set up and you have populated your study data, you can now check your Analyses.
On the main Analyses page, select the Analysis you want to check. You will notice the analysis table is now populated with the number of studies, participants and analysis data. Click Edit Analysis and select the Graph tab.
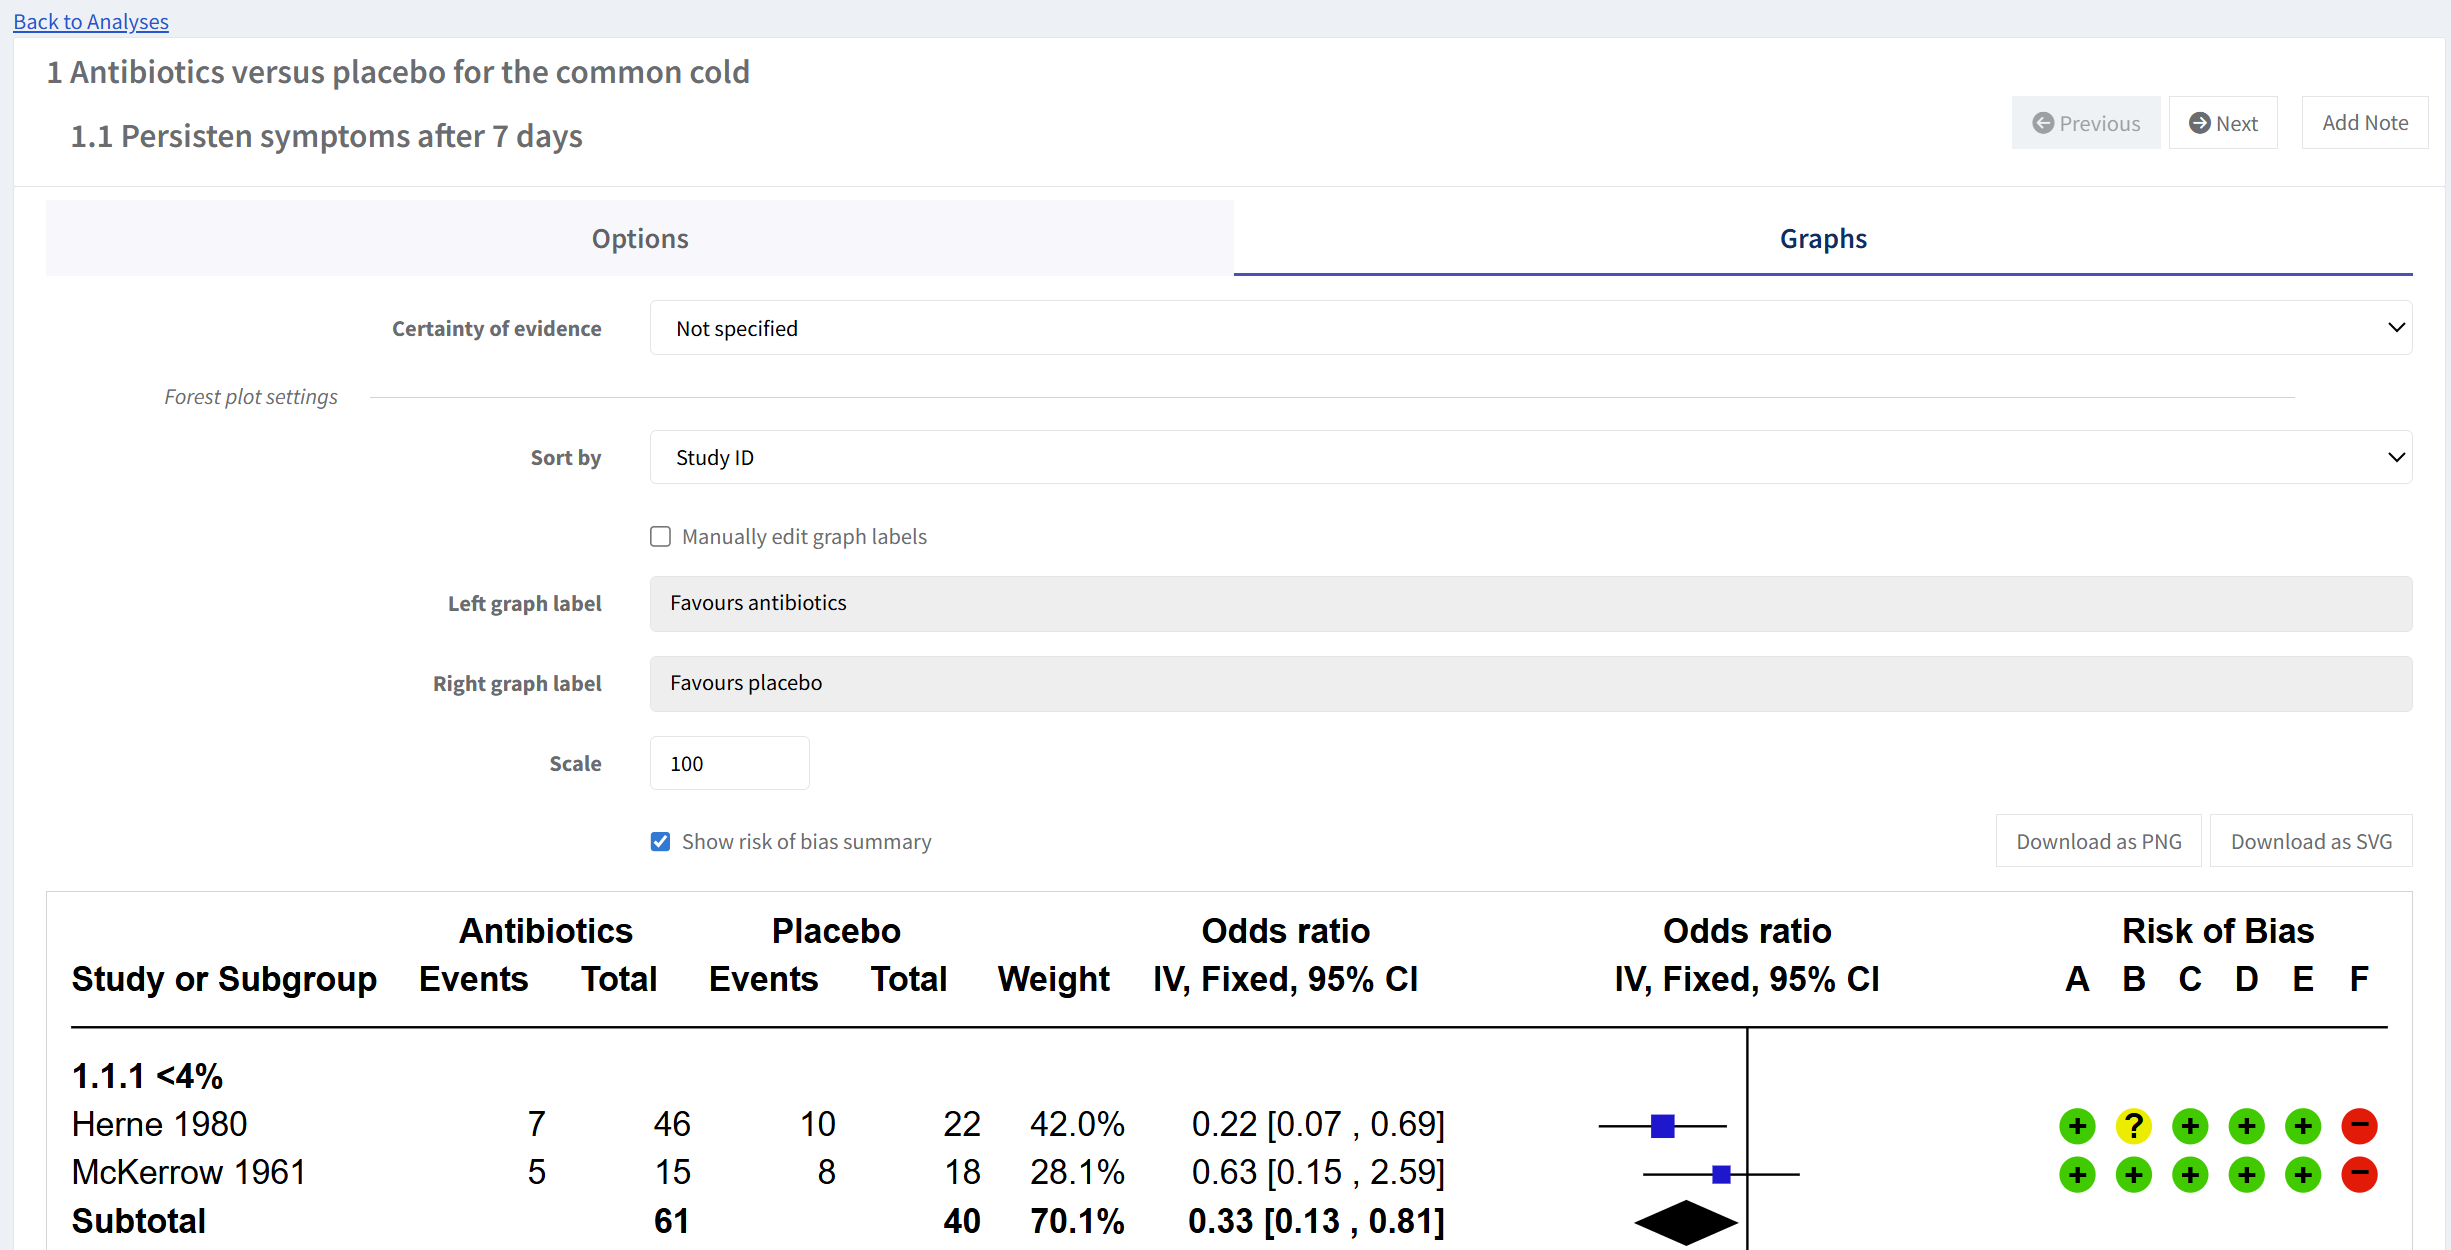
The certainty of the evidence can be selected to help reporting your analysis results in the review article.
If you have set the direction for your outcome, the graph labels can be automatically populated. You can choose to manually edit the graph labels if needed by ticking the box 'Manually edit graph labels'.
You can decide whether or not to display Risk of bias data relevant to the results in your graph.
For the example syntheses described in Set the Synthesis PICO, here are the example forest plots if you navigate to the Graph tab.
The example shows a broad synthesis question using intervention groupings. It includes 'Persistent symptoms after 7 days' as the Outcome, 'Antibiotics' (all antibiotics) as the Experimental Intervention and 'Placebo' as the Control Intervention.
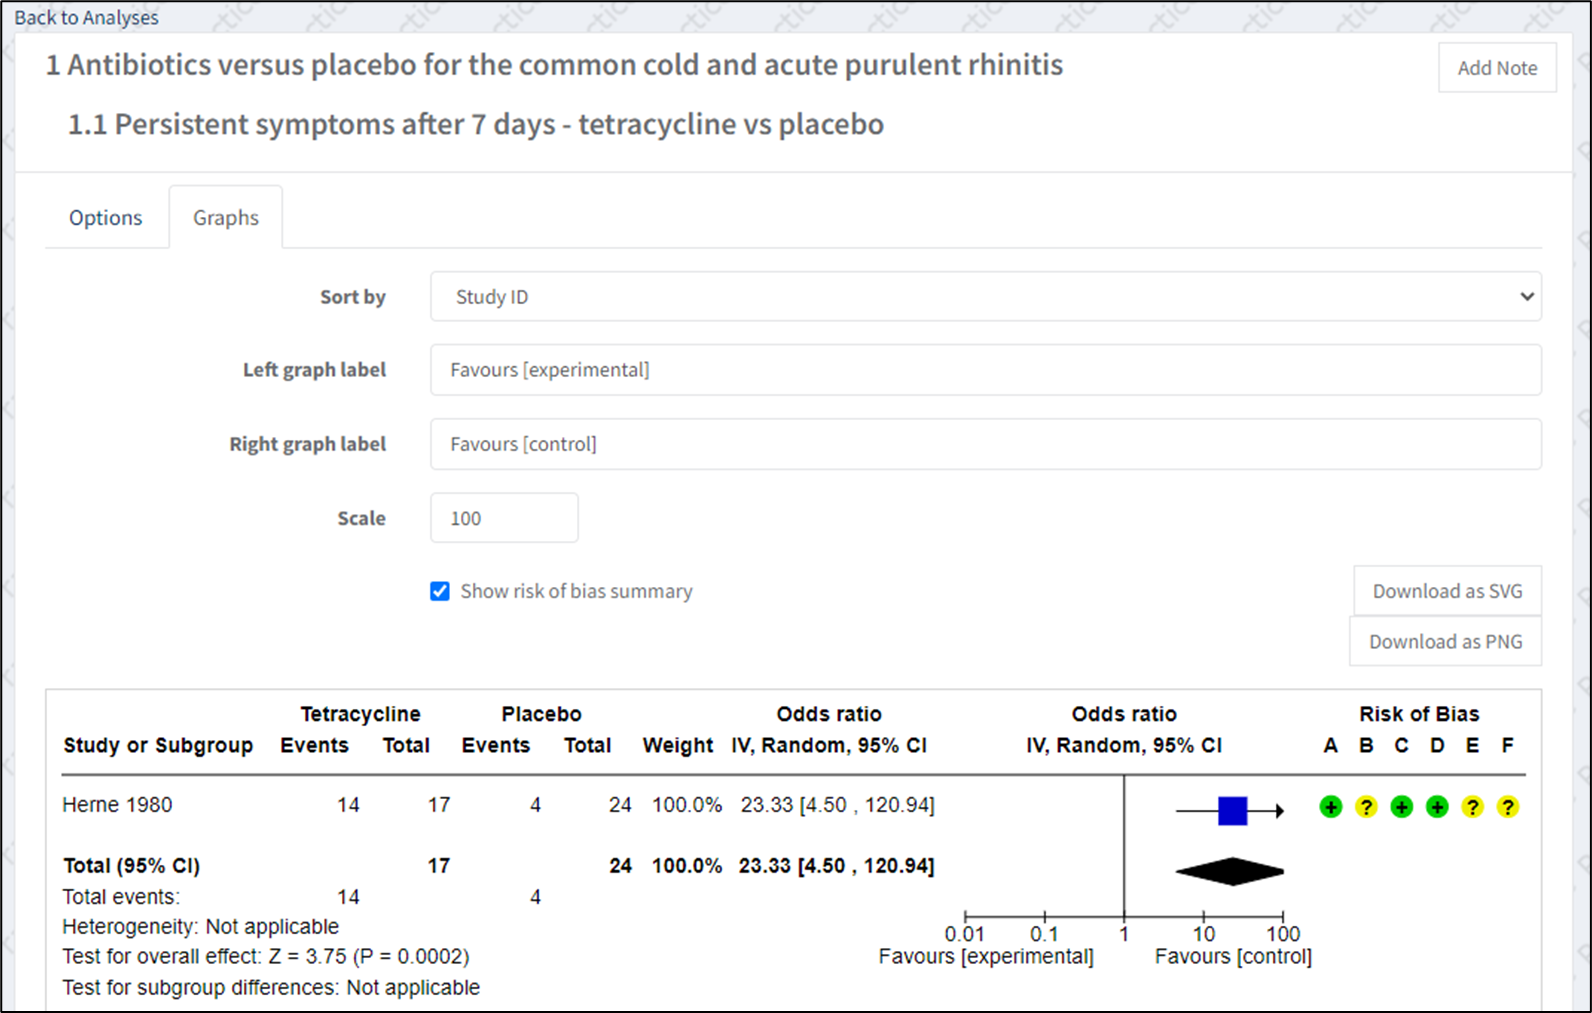
The example shows a narrower synthesis question using the more granular interventions based on a specific antibiotic versus placebo. It includes 'Persistent symptoms after 7 days' as the Outcome, 'Tetracycline' as the Experimental Intervention and 'Placebo' as the Control Intervention.
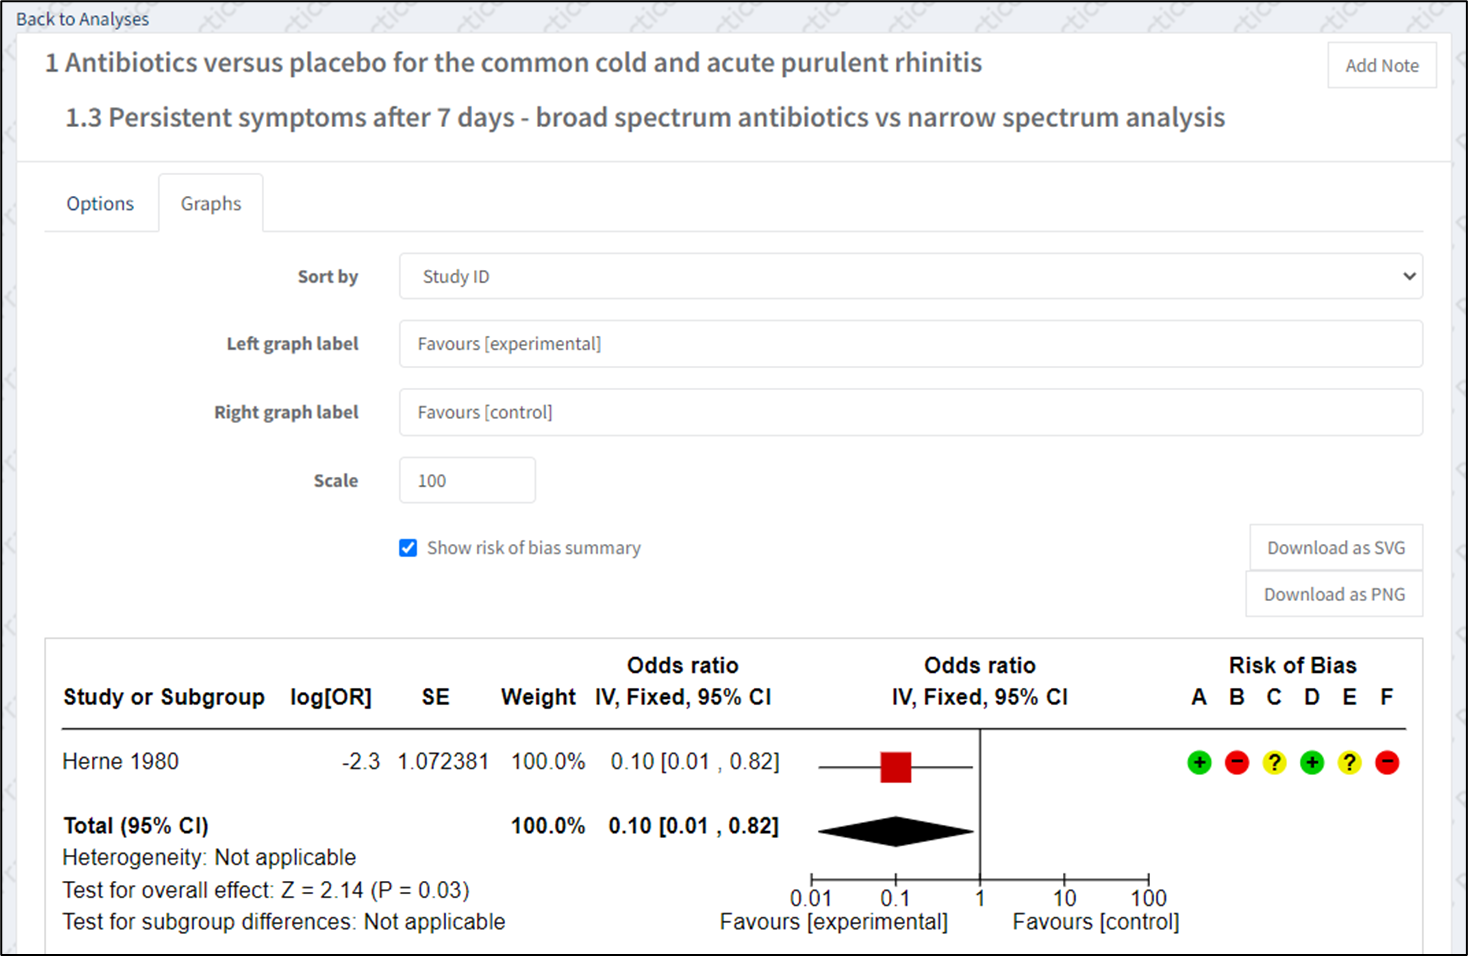
The example shows a narrower synthesis question using the more granular interventions based on antibiotic coverage. It includes 'Persistent symptoms after 7 days' as the Outcome, ' Broad-spectrum antibiotic' as the Experimental Intervention and ' Narrow spectrum antibiotics' as the Control Intervention.