Add a Figure
Renumbering and positioning of figures in the review
In the view generated using the options 'View a version' and 'Submission preview', and in the PDF article, figures are renumbered to reflect the position in which they are linked in the review.
In the published review, figures are placed at the end of the paragraph in which the link appears. If a figure is linked more than once in the text, the second and subsequent links will point to the figure at the first time it appears in the text. Use the browser's back button to return to the section you were navigating before being redirected. The positioning of figures cannot be previewed in RevMan.
Figures in focused review format
Figures within the main article should include:
- PRISMA flow diagram
- Visual representation of syntheses for each outcome, such as forest plots
- Other figures that support the outcomes in the Summary of findings table(s).
- Others as appropriate, such as funnel plots
All syntheses and subgroup and sensitivity analyses will be included in the ‘Analyses’ supplementary material and should not be duplicated in the main article unless they support the outcomes in the Summary of findings table(s).
All Figures must be linked to from within the main article text.
Figures in long review format
Figures within the main article should include:
- PRISMA flow diagram
- Others as appropriate, such as funnel plots
Figures in Appendices
Figures that are part of data/analysis are automatically included in the review and will be duplicated if they are linked in an Appendix. Other figure types not automatically included, will not be duplicated if linked in an Appendix.
Figure validation
The maximum recommended number of figures is 6. You will see a validation warning if you exceed this.
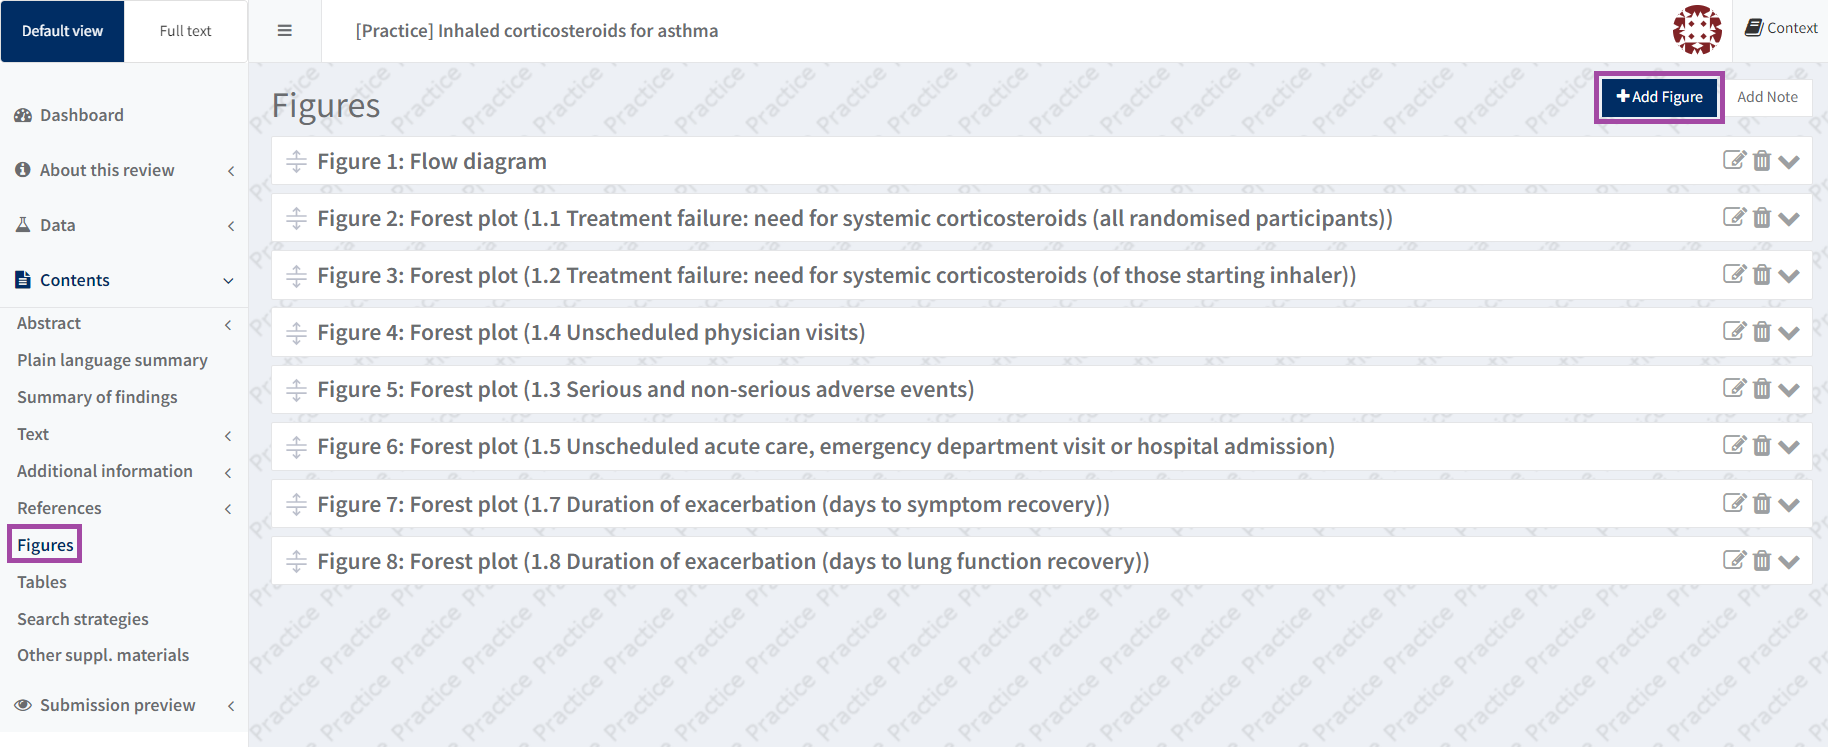
Add a figure
Go to the 'Figures' section in the left-hand navigation menu, then click on the 'Add Figure' button.
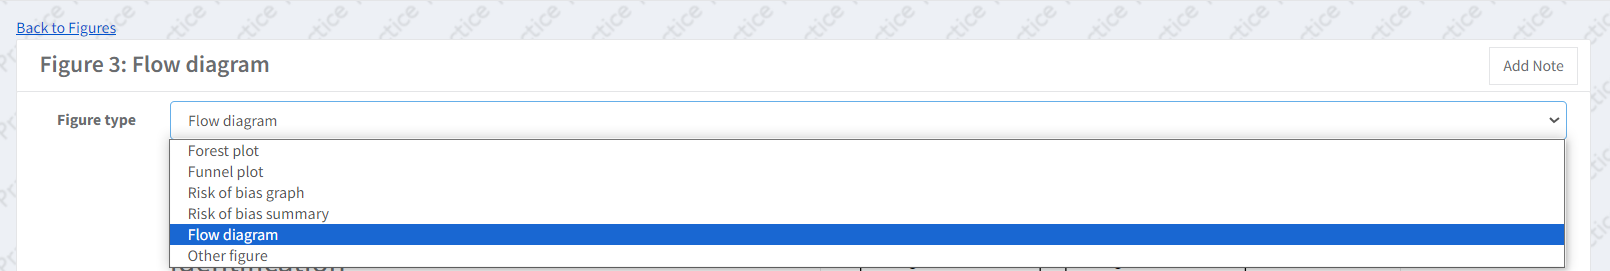
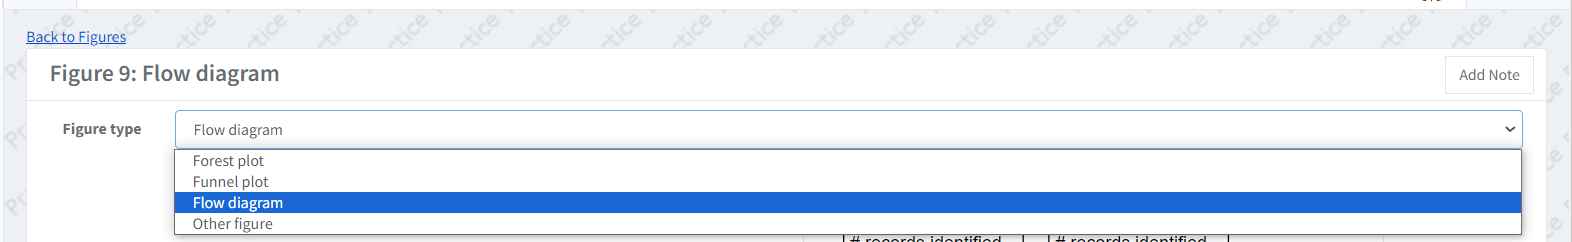
Select the figure type
You can select one of 4 or 6 figure types, depending on which risk of bias method is used in the review:
- Forest plot
- Funnel plot
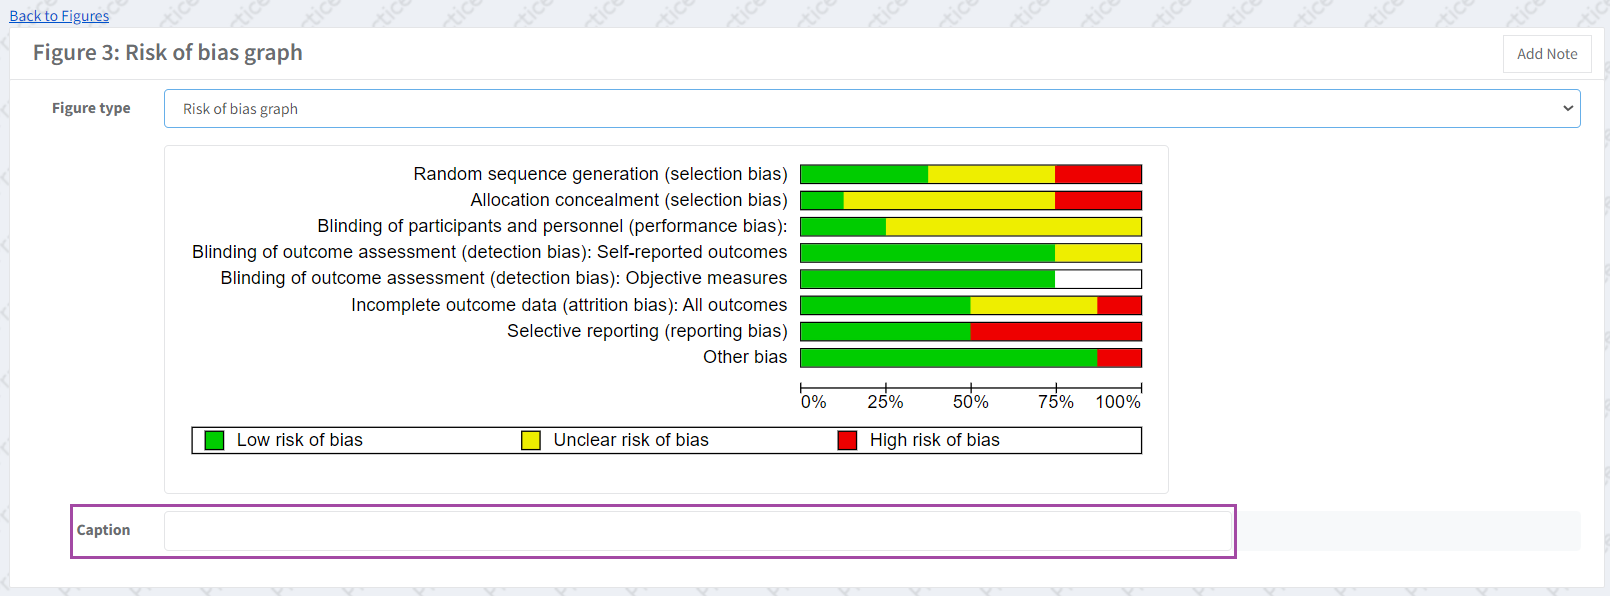
- Risk of bias graph (rob1 only)
- Risk of bias summary (rob1 only)
- Flow diagram
- Other figure - see Import an external figure
Risk of Bias 1:
Risk of Bias 2:
DTA reviews
The figure types available for DTA reviews are:
- SROC plot
- Forest plot
- Methodological quality graph
- Methodological quality summary
- Flow diagram
- Other figure - see Import an external figure
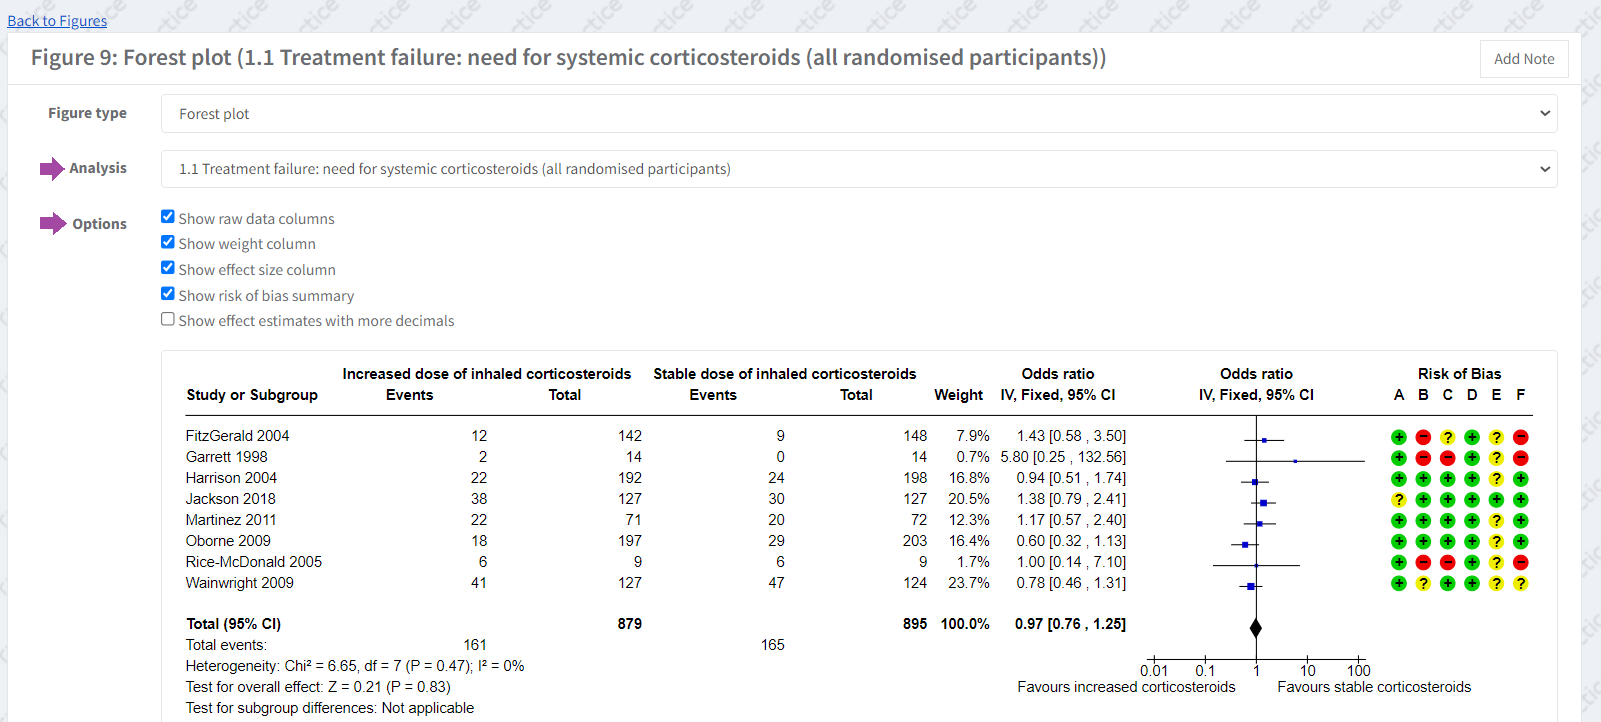
Select the outcome and data to be displayed
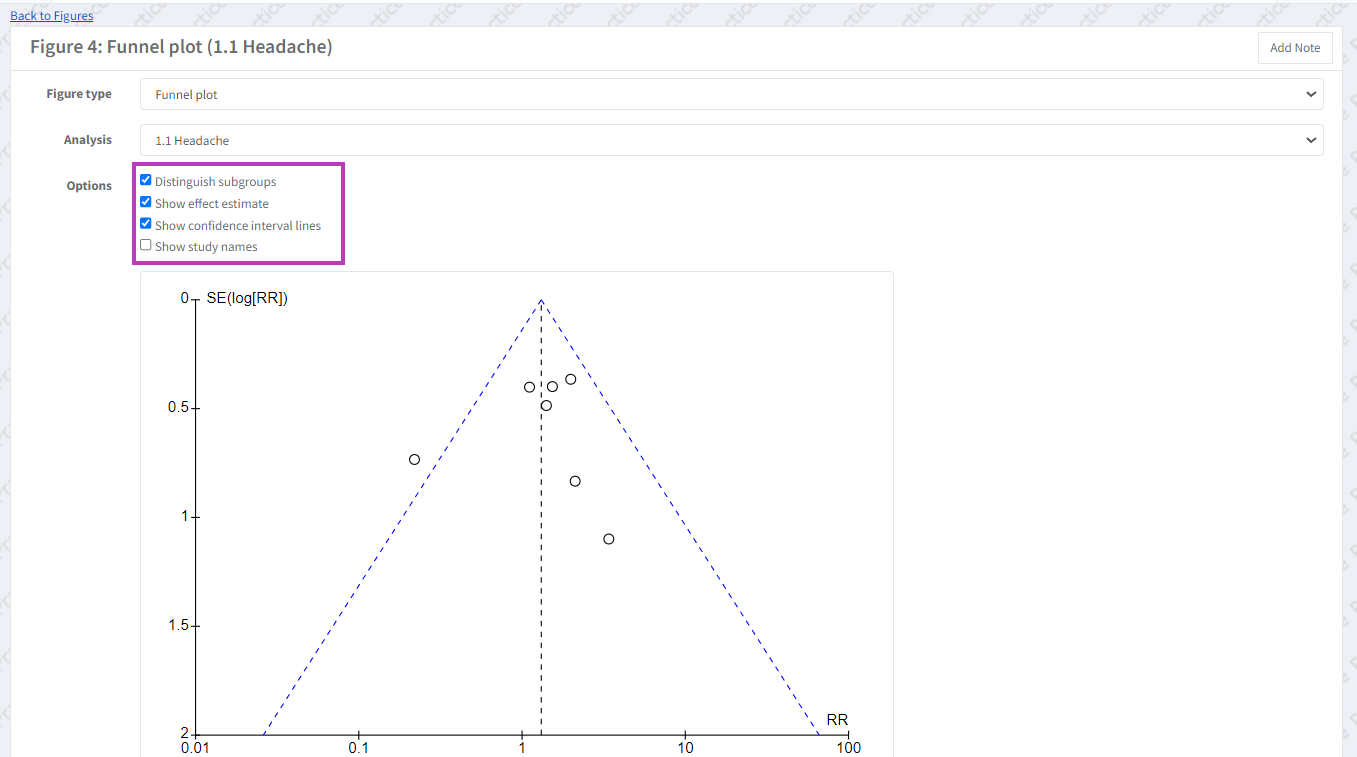
For Forest plots and Funnel plots, select the outcome you want presented. Then, select which data you want to display by checking or unchecking the boxes under 'Options'.
Show study names (funnel plots)
The options available to display data in Funnel plots also include showing study names. This option is turned off by default due to instances where study names overlap. If this is not the case, authors can decide if they want to turn the feature on.
Please note that how study names are displayed in the figure in RevMan corresponds to how they will appear in the review version downloaded for submission.
Show confidence interval lines (funnel plots)
A triangular 95% confidence region can be included in a funnel plot if based on a fixed-effect meta-analysis. The lines represent the upper and lower bounds of the triangular 95% confidence region and show the expected distribution of studies in the absence of heterogeneity or of selection biases. More information is available in Chapter 13 of the Cochrane Handbook for Systematic Reviews of Interventions.
Add a caption (i.e. figure title)
All Figures have a Caption box so you can give the Figure a title/description. This box for giving the figure a title is located at the bottom of the figure, as it is published below the figure on the Cochrane Library.
Import an external figure
To import an external figure, select 'Other figure' from the 'Figure type' drop-down menu. Then click on 'Choose file' to upload an image.
Image size
Images added in RevMan must have a minimum width of 500 pixels. You will see a validation warning if your image does not meet this requirement.
Wiley advise that images should be less than 1650mm wide. Images wider than this will be resized in the published PDF.
There is no set maximum size in pixels. Wiley suggest a maximum width of 2000 pixels will result in a good quality image when published.
However, please note that large images do affect the size of submission files, which can cause problems - for instance with comparing versions, with generating the submission files and possibly affecting publication.
If there are multiple figures to import and the size of the review will be very big, please consider using an open online repository, as detailed in External data and files.
If you have questions about a particular image or the review size please contact support@cochrane.org.