-
Created by
 Rebecka Hall, last updated by Rasmus Moustgaard on Nov 08, 2024
5 minute read
Rebecka Hall, last updated by Rasmus Moustgaard on Nov 08, 2024
5 minute read
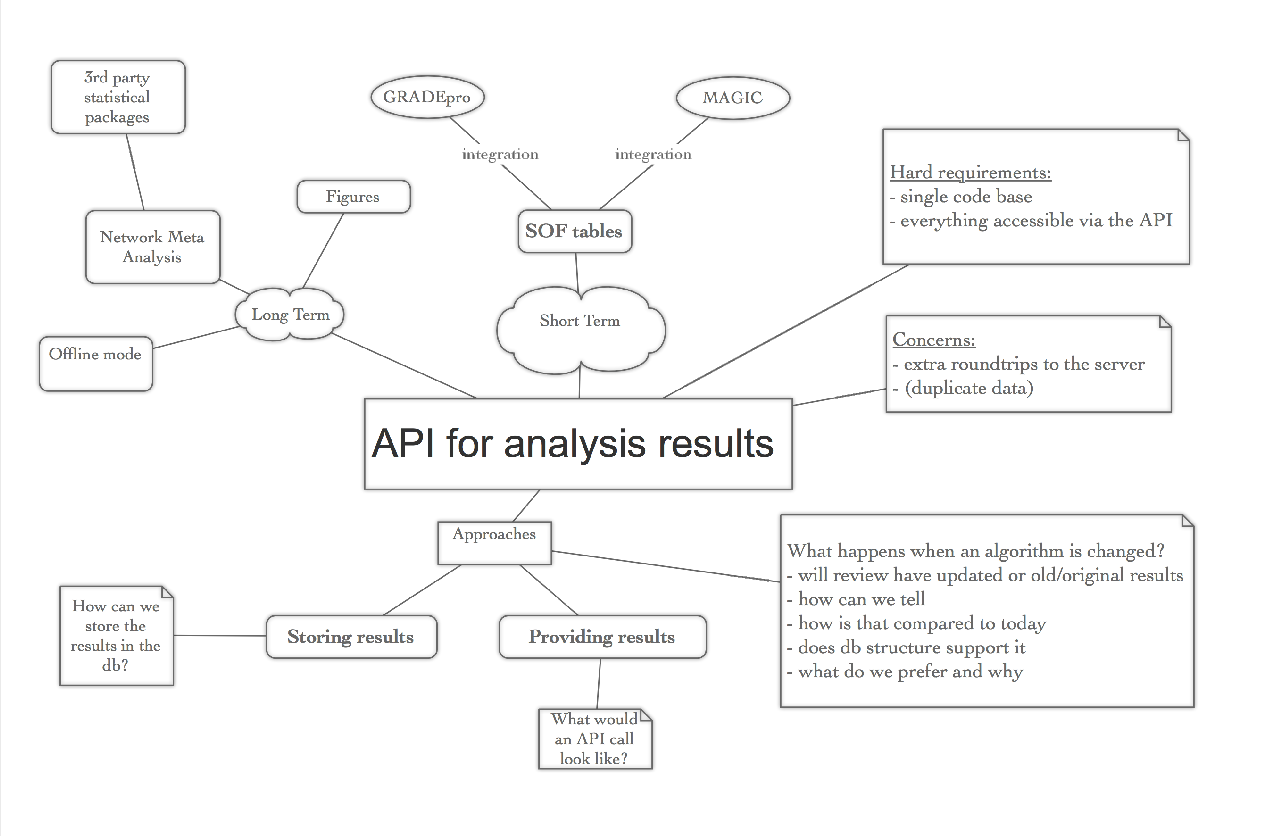
The immediate need for this is driven by GradePRO & MAGIC integrations, but longer-term we also need to be able to insert results and figures into reviews for publication, to handle calculations that are not available client side (e.g. network meta-analysis), and to save analysis results as they were at the time in case statistical code changes.
API to provide analysis results for SoF tools
In order to support GRADEPro & Magic integration we need to make results of analysis available outside the revman client.
This page describes some of the the considerations that we've had before undertaking this task.
Code re-use or serverside only or rewrite in java?
Since our .js code for meta-analysis is fairly well documented and tested, just re-using the javascript code in the backend seems to require the least amount of effort.
Rewriting in java for a sever side only solution doesn't seem worth it since the benefits of simplicity and consistency of having a java only backend would be shortlived as we're most likely going to interoperate with 3rd non-java party libraries for network meta-analysis.
We're also gravitating away from a serverside only solution because some of the javascript that we rely on for calculations are also required by the clientside calculator.
DECISION: the existing JS analysis code and test suite will be separated into an independent NPM package. This will be a dependency for RevMan Web, and a (to be developed) Node.js analysis backend that ReviewDB will call to get results.
Client API
Endpoint: /reviews/{reviewid}/comparisons/{comparisonId}/outcomes/{outcomeId}/result
There are several options for client API that closely tied to future developments.
Mixing derived values and actual data is one concern.
Requiring 2 roundtrips also seems suboptimal (fetching "input" and results). It might be non trivial for clients to reassemble inputs and results.
Results endpoint also returning data of its "parent" (ie outcome) also feels wrong.
DECISION: the API will return only results, with IDs of the associated input objects attached. The endpoint may be extended to also provide the inputs
There is no ReviewDB endpoint for DTA reviews - only the backend backend.
JSON model for analysis results
The following describes the structure of the JSON returned by the API:
export interface IntResult {
    result: OverallResultData;
    dataRows?: RowResultData[];
    subgroups?: SubgroupResult[];
}

export interface SubgroupResult {
    result: SubgroupResultData;
    dataRows: RowResultData[];
}

// mean, ciStart, ciEnd, piStart, piEnd, CiStartOther, and ciEndOther are
// on the scale of analysis, so log scale for log scale outcomes.
export interface ResultData {
    estimable: boolean;
    logScale: boolean;
    mean: number;
    se: number;
    ciStart: number;
    ciEnd: number;
    piStart: number;
    piEnd: number;
    weight: number;
}

export interface RowResultData extends ResultData {
    id: string; // This is not included in the meta-analysis API output, but is added by ReviewDB.
    studyId: string;
    applicability?: "SUBGROUP_ONLY" | "OVERALL_ONLY" | "SUBGROUP_AND_OVERALL";
    notIncludedInTotal?: boolean; // Used to indicate that a subgroup row is not included in the calculation of the total
}

export interface SubgroupResultData extends ResultData {
    id: string; // This is not included in the meta-analysis API output, but is added by ReviewDB.
    heterogeneity: {
        chiSquared: number;
        degreesOfFreedom: number;
        iSquared: number;
        p: number;
        tauSquared?: number;
        ciEstimable?: boolean;
        ciStart?: number;
        ciEnd?: number;
        ciStartSign?: string;
        ciEndSign?: string;
    };
    overallEffect: {
        z: number;
        p: number;
    };
    experimental: {
        events?: number;
        total: number;
    };
    control: {
        events?: number;
        total: number;
    };
    dataRows: RowResultData[];
}

export interface OverallResultData extends SubgroupResultData {
    subgroupDifferences: {
        chiSquared: number;
        degreesOfFreedom: number;
        iSquared: number;
        p: number;
    }
}
export interface DtaResult {
    diagnosticSubgroups: DtaSubgroupResult[];
}

export interface DtaSubgroupResult {
    a: number;
    b: number;
    meanD: number;
    diagnosticDataRows: DtaDataRowResult[];
}

export interface DtaDataRowsResult {
    diagnosticDataRows: DtaDataRowResult[];
}

export interface DtaDataRowResult {
    sensitivity: number;
    sensCiStart: number;
    sensCiEnd: number;
    specificity: number;
    specCiStart: number;
    specCiEnd: number;
    d?: number;
    s?: number;
    weight?: number;
    scaleSpec?: number;
    scaleSens?: number;
}
Platforms/protocol for analysis backend
DECISION: The web interface will expose an HTTP API. Other options considered are described below.
WAMP RPC
While we do have a proof of concept, this solution would increase coupling between backend and backend backend, since an RPC binding is quite strong.
It would also make us more dependent on crossbar.io which is currently "only" being used for concurrent editing - this is only a minor concern.
RabbitMQ
RabbitMQ (or any other messaging queue) might seem more robust since an asyncronous solution can sometimes continue to work despite outages.
In this use case however, we won't be able leverage this advantage since we're calling backend in a syncronous context (we're in the process of serving an http-request).
This option may become more appealing if we later decide not only to perform calculations on demand.
HTTP/REST
We're using REST-like apis in most other scenarios.
It's a weaker dependency than RPC.
JSON model for analysis backend
The output of the analysis backend will be identical to the output of the client API (shown above), with the IDs omitted. The input data structure is as follows:
 // Both dataRows and subgroups should be provided when the overall results should be based on a separate analysis, e.g. subgroups with studies split by intervention.
export interface IntInput {
    options: InputOptions;
    dataRows?: InputData[];
    subgroups?: InputSubgroup[];
}

export interface InputOptions {
    dataType: InputDataType;
    method: InputMethod;
    effectMeasure: InputEffectMeasure;
    model: Model;
    heterogeneityEstimator?: HeterogeneityEstimator;
    ciMethod: CIMethod;
    ciLevel: 0.90 | 0.95 | 0.99;
    swapEvents: boolean;
    logData: boolean;
    totals: Totals;
}

export interface InputSubgroup {
    dataRows: InputData[];
}

export type InputData = DichotomousInputData | ContinuousInputData | ContrastInputData | ObservedExpectedInputData;

export interface DichotomousInputData {
    studyId: string;
    experimental: {
        events: number;
        total: number;
    };
    control: {
        events: number;
        total: number;
    };
    applicability?: Applicability;
}

export interface ContinuousInputData {
    studyId: string;
    experimental: {
        total: number;
        mean: number;
        sd: number;
    },
    control: {
        total: number;
        mean: number;
        sd: number;
    }
    applicability?: Applicability;
}

export interface ContrastInputData {
    studyId: string;
    estimate: number;
    se: number;
    experimental?: {
        total: number;
    };
    control?: {
        total: number;
    };
    applicability?: Applicability;
}

export interface ObservedExpectedInputData {
    studyId: string;
    oe: number;
    variance: number;
    experimental?: {
         events: number;
         total: number;
     };
     control?: {
         events: number;
         total: number;
     };
    applicability?: Applicability;
}
export interface DtaInput {
    diagnosticOptions: DtaInputOptions;
    diagnosticDataRows?: DtaTestDataRowInput[];
    diagnosticSubgroups?: DtaSubgroupInput[];
}

export interface DtaInputOptions {
    scale: Scale;
    weight: Weight;
    ciLevel: 0.90 | 0.95 | 0.99;
}

export interface DtaSubgroupInput {
    diagnosticDataRows: DtaTestDataRowInput[];
}

export interface DtaTestDataRowInput {
    tp: number;
    fp: number;
    fn: number;
    tn: number;
    covariateScaleValue?: number;
}